The biological sustainability of a forest can accurately be measured via two primary methods. The first method seeks to measure the volume of forest inventory; analyzing inventory changes over time is an effective way to gauge the balance of growth and removals in a specific geographic area. In this scenario, inventory increases indicate that biological tree growth outpaces removals, and inventory decreases indicate that removals outpace tree growth.
The Forest Inventory Analysis, overseen by the US Forest Service, is the standard measure of forest inventory across the country. Every five years, timber tracts throughout all forested regions in the United States are randomly selected and inventoried. Forest Service employees survey each plot to determine the amount of forest growth and removals, and record any other changes that may have occurred. Forest service personnel identify each tree by species and measure both diameter and height. Using this very exact data, FIA can assess the condition of timberland resources at a local level.
The second (and more precise) method to gauge the balance of growth and removals is to analyze the growth-to-removal ratio (GRR), which reflects the extent to which growth outpaces removals, or vice versa. Unlike the static view provided by forest inventory, the GRR measures the balance between supply and demand. Growth-to-removals – the biological increase in inventory compared to harvests – demonstrates the trajectory of forest inventory.
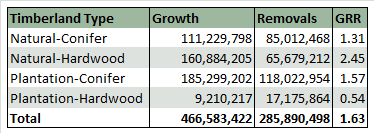
The GRR is calculated by dividing growth by removals. If the result is over 1.0, more wood was grown in the forest than was removed during that time period. If it is less than 1.0, more wood was removed than was grown. This figure also describes the extent to which growth outpaces removals. For example, a GRR of 1.33 means that growth outpaced removals by 33 percent, whereas a GRR of 1.06 means that growth outpaced removals by 6 percent. Conversely, a GRR of 0.95 means that removals outpaced growth by 5 percent and a GRR of 0.78 means that removals outpaced growth by 22 percent (see sample chart below).
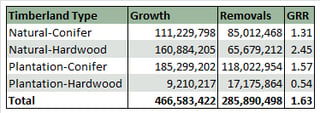
Over the long run, a GRR that remains below 1.0 can negatively affect forest sustainability, limit harvest opportunities and place upward pressure on wood fiber prices. Like any piece of data, it is important to consider GRR within the proper context. A cursory glance at one segment of data – such as the year 2019 in the sample table below – could lead one to believe a forest is in decline.

Interpreting the Data
While it is true a GRR below 1.0 indicates harvests outpace forest growth, this dip below 1.0 is simply a function of a normal, expected age-class gap created when trees are not replanted as anticipated. The Great Recession that created a housing downturn is a prime example of this concept. As many landowners delayed pine sawtimber harvests when demand for lumber declined, replantings were also delayed. This created an age-class gap for the years when pulpwood—had it been replanted on schedule—would have been thinned to make room for sawtimber to grow.
Generally speaking, when sawtimber harvests increase, replantings increase in tandem and the cycle reverses itself in a short span of time. It is important to remember that gaps like these are natural reactions to the market, not harbingers of deforestation or a lack of sustainable supply.
Changes in demand brought about by factors such as competition entering or exiting the market or the introduction of new products will invariably impact the GRR of any wood basin. When forecasting GRR, scenarios for both supply (forest growth) and demand (current removals +/- changes in demand) must be modeled and applied by industry experts in order to gain an accurate picture of sustainability.
Using the Data
The point at which competition for wood causes harvest removals to exceed forest growth is called a tipping point. To determine which demand scenarios are feasible from both a forest health and wood raw material cost perspective, Forest2Market conducts tipping point analyses.
A number of steps go into finding a wood basin’s tipping point, and analysts must begin by determining current forest inventory and projecting future inventory. They must also develop a market price threshold, which is typically the maximum weighted per-ton average a company can pay for material. Finally, the analysts create marginal cost curves based on the transactional data available in Forest2Market’s delivered price database.
A final analysis of these factors provides the maximum number of demand (tons) a wood basin can supply without negative ramifications. This represents the tipping point for facility-specific factors such as maximum feedstock costs, as well as larger variables like the overall sustainability of the wood basin itself.
A tipping point analysis offers an in-depth look at complex wood supply chain dynamics and the competitive nature of forest products markets. While the analysis accurately catalogs the current and near-term sustainability of a particular wood basket, it also identifies the point at which the depletion of forests would become a reality. Such data is beneficial for those engaged in forest sustainability initiatives, as well as wood-consuming customers that would otherwise be adversely affected by unsustainable harvest methods.