 Pete Coutu
In a manufacturing process where over 75 percent of the cost of the finished product can be attributed to raw material costs, constant attention to the details involved in procuring those raw materials is imperative. For a modern wood products operation, this raw material cost comes in the form of harvested timber that has been delimbed and transported to the mill facility as logs on logging trucks. Since these truck deliveries keep the mill’s equipment busy—while representing an enormous investment—procurement and supply chain operations can make or break a facility’s profitability.
For instance, in a streamlined sawmill operation, the key to managing the high cost of raw materials while maximizing output is buying the right sized log at the right price. Each mill has an ideal log size, which is a specific diameter and length, and is ideally-suited for the mill’s unique processing setup and the market conditions. When the mill saws this log size, it runs at maximum efficiency. Going one step further, minimizing variability in the ideal log size is also vital to maximizing outputs and profits.
While my colleague Joe Clark notes that growing square trees would make life much easier for any sawmill, the reality is that managing a mill’s supply chain cost with quality data is the next best solution for running as efficiently as possible. Forest2Market’s Delivered Price Benchmarks are built upon a bedrock of transaction-based data providing a high level of detail into mill raw material costs, as well as individual cost components and their variables.
These benchmarks provide a wealth of information that allows a wood-consuming facility to compare its raw material cost to regional competitors and begin the process of identifying areas where supply chain value can be increased. It is important to note that increasing supply chain value is different than simply lowering price; improving the supply chain implies that most, if not all, members of the supply chain (landowner, logger, trucker and mill) will benefit from the increased efficiency.
How to Use the Delivered Price Benchmark
Analyze raw material costs and individual cost components: The raw material comparisons are initially done geographically by region, and the number of comparable mills within the study area may vary depending upon competitor density. The benchmark also addresses log size variability and haul distance as well as other variables to meet a facility’s unique operations.
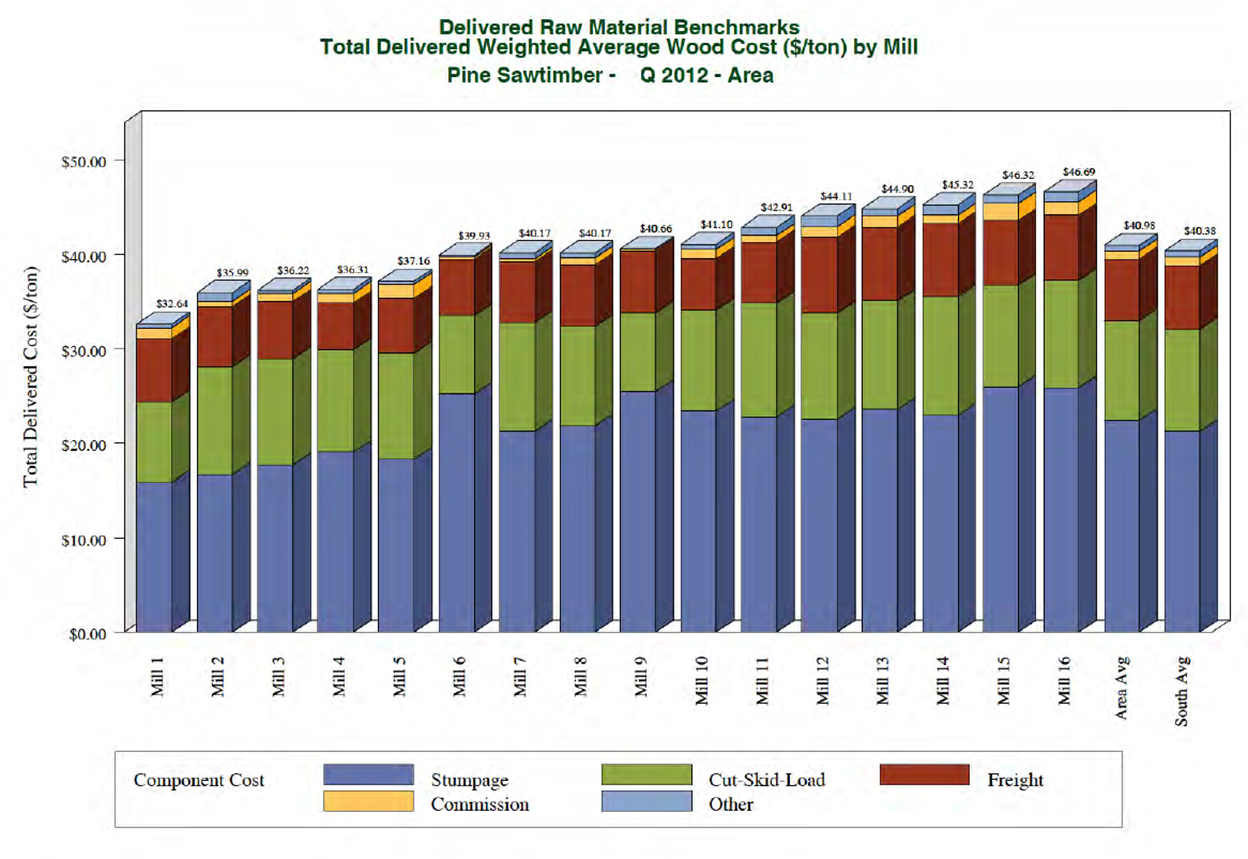
The benchmark delves into individual cost components by mill and creates a weighted average, as well as area regional averages for total delivered wood costs. This allows for a much more granular view of the many moving pieces that make up the total raw material cost. In the sample below, pay close attention to Mill 6; while it is not leading the pack, it is outperforming the area average. Two components immediately stand out: its stumpage costs are some of the highest in the entire area, and its cut-skid-load, freight and commission costs are some of the lowest. If this mill were to reign in its high stumpage costs alone—even in line with the area average—it would likely become the top performing mill in the area.

Analyze log sizes and costs: In the sample chart below, each of the mills average wood costs by PLF (pounds per linear square foot) is plotted against the market average (red line). While a few mills fall pretty close to the market average cost, many do not; they are either beating the market or paying above market price when measured in PLF.
As noted above, running the ideal log through a mill ensures that it operates at peak efficiency and paying a higher price for this ideal log may ultimately ensure mill profitability. Another factor to consider is haul distance. Since Forest2Market collects origin and destination data, mileage calculations will tease out nuances in mill performance. Note the dot at the highest point in the chart below, which represents a mill’s average wood cost by PLF at nearly $47/ton. While that is the highest price in the study area, it could 1) represent the ideal log size for that mill, 2) include additional freight charges associated with long haul distances, or 3) represent an area that needs substantial improvement to bring costs back in line with the market average.

Analyze all cost components with variables: The chart below provides a full-spectrum view of all cost components and variables for the sample mills in the area, and some of these items stand out and allow us to draw certain conclusions from the data. For instance, Mill 1 has the lowest total wood cost per ton. It’s PLF or log size, however, indicates it is running very small logs, which may limit the number and type of products it can saw and sell on the market. At the other end of the spectrum, Mill 16 has the highest wood cost per ton but also has a substantially higher average PLF, which means that Mill 16 should have more product flexibility. This mill may change saws or setup to create a number of lumber products because it is running much larger logs through the system.

Does mill flexibility lead to profitability? Not necessarily. As stated above, a number of operational factors must be taken into consideration because each mill is unique. But the data shows these individual supply chain cost components, which provide a distinct view into area and regional competition.
In an industry with very tight margins, reducing raw material cost is the key to competing in today’s lumber market—especially in the current economic and trade climate, which is so immersed in uncertainty. A wood-consuming facility that understands total log cost, individual cost components and the variable elements of these costs (haul distance, log size, etc.) is in a much better position to shape a successful strategy for log procurement efforts that will ultimately drive mill performance. With raw material being such a significant portion of the finished product cost, increasing supply chain value is critical to success and profitability.