
 Daniel Stuber
Forest2Market’s Western Hemisphere Benchmark allows producers to compare their own raw material costs to the market average in one of several ways. The first is by end-product segment. If, for example, you produce boxboard, you can compare your costs to the market average for all boxboard producers. The second way you can benchmark your performance is by product species. If you consume conifer (softwood), you can compare your costs to those of all other softwood consumers (the same is true for hardwood). Third, you can compare your costs by region. If you are in the US South, for instance, you can compare your costs to average costs in the US South. Finally, because markets for pulp and paper are global, you can understand your relative cost position compared with other producers in the Western Hemisphere.
Delivered Wood Fiber Prices for End-Product Grades
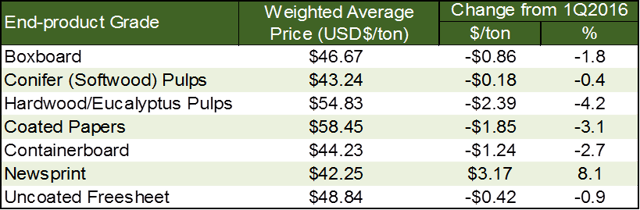
Wood fiber prices decreased for the majority of pulp and paper producers in the 2nd quarter, particularly the hardwood pulps, coated papers and containerboard segments. Forest2Market’s Western Hemisphere Benchmark shows that these three segments dropped more than USD$1-2/ton.
Below are 2Q2016 results (average, price change) compared to 1Q2016 for various end-product segments:
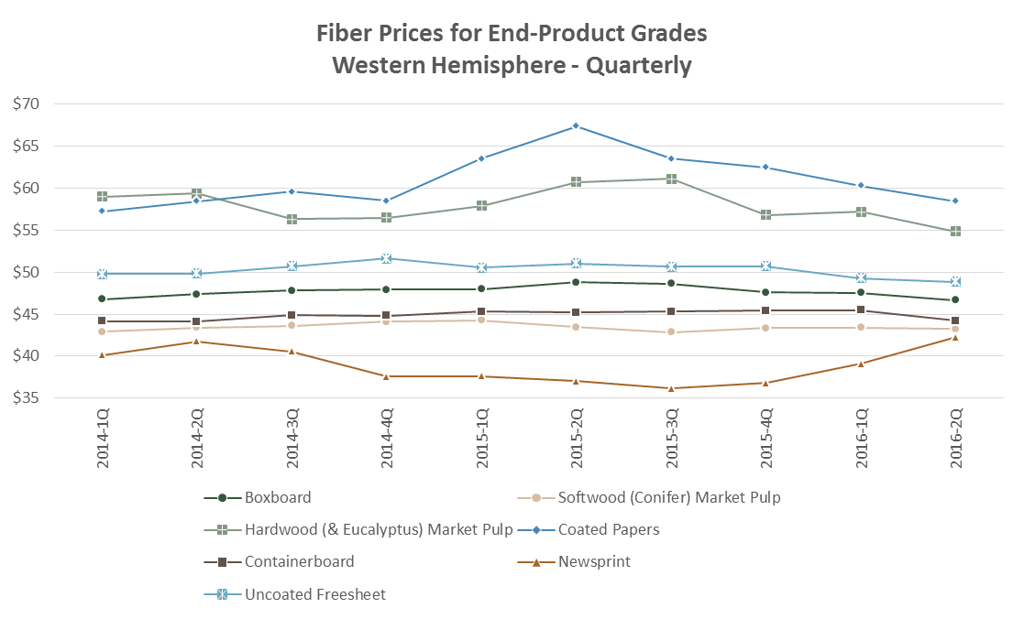
When competing in global end-product markets, it is important to know where your fiber costs fall. If you are higher than average, taking action to lower these costs so that they are in line with market rates can have a significant impact on your company’s competitiveness.
Delivered Conifer (Softwood) Wood Fiber Prices
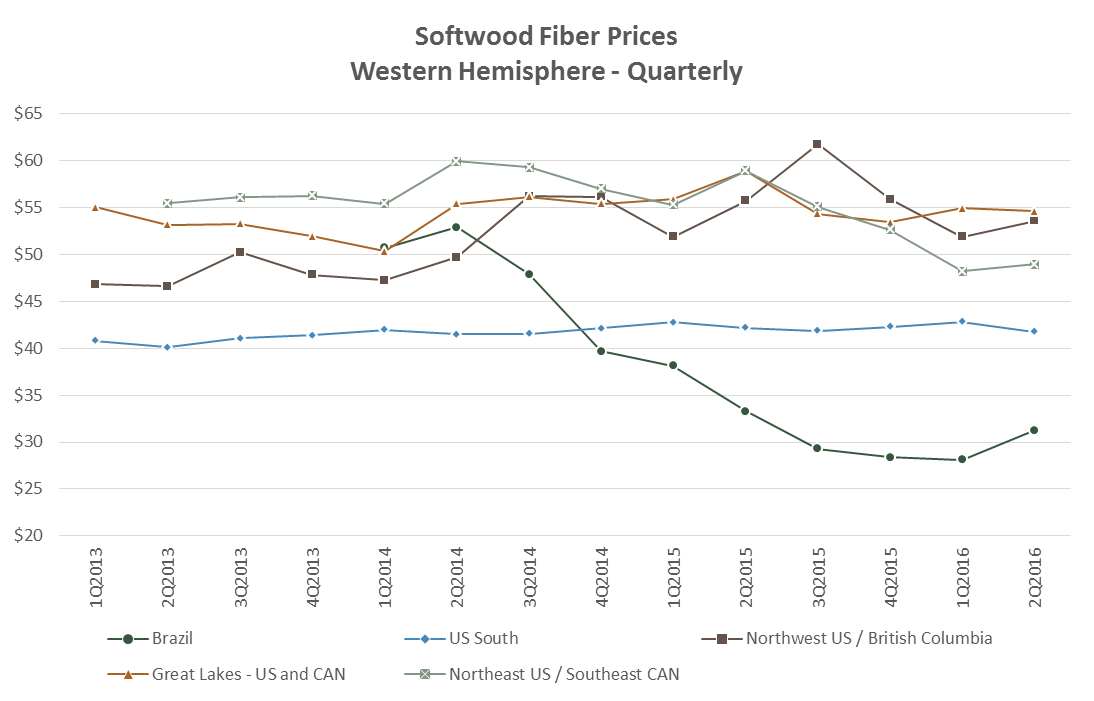
Brazil
Brazil has been the lowest cost region for softwood fiber since the end of 2014. Helped along by an ultra-competitive pulpwood market and the growing differential between the strong US dollar (USD) and the Brazilian Real (BRL) (which has lost 30 percent of its value during the country’s recession), Brazil has made significant headway into US markets, making it more difficult for American producers to compete.
During 2Q2016, wood fiber prices in Brazil increased USD$0.66/ton (1.5 percent) while the BRL strengthened against the USD by 11 percent. Accounting for the exchange rate, Brazilian wood fiber prices averaged USD$31.25/ton, an increase of USD$3.13/ton or 11.1 percent from 1Q2016.
Second quarter results for US producers showed the effects of Brazil’s success in this regard. Brazil continues to maintain its low-cost position against other regions, but the price gap compared to the US South has tightened. In 1Q2016, the gap was USD$14.70/ton; in 2Q2016, the gap shrank to USD$10.50/ton.
US South
US South conifer fiber prices declined USD$1.07/ton (2.5 percent) to average USD$41.75/ton, which helped to reduce this gap as well. Part of the decrease was due to normal seasonality, and part was due to increased sawtimber harvest activity (up 5.0 percent in 2Q2016), which increased pulpwood supply. Despite the decline, softwood fiber prices are more stable in the US South than they are in any other region in the Western Hemisphere.
Northwest US & British Columbia
In the Northwest US (NW) and British Columbia (BC), differences in sawmill production have led to two disparate trends in wood fiber pricing. Due to the expiration of the Softwood Lumber Agreement (SLA) and market conditions for lumber between Canada and the US (as well as China), Canadian producers have increased production and exports into the US. At the same time, Northwest sawmills have slowly decreased production. As a result, residual wood chip supply has increased in BC easing delivered prices, while residual chip supply has decreased in the Northwest US causing an increase in the use of more expensive whole log chips and, in tandem, an increase in overall wood fiber prices. In terms of the Canadian dollar (CAD) to USD exchange rate, the CAD strengthened against the USD by 6.7 percent. The combination of these events caused conifer prices to average USD$53.58/ton in 2Q2016, an increase of USD$1.66/ton (3.2 percent) from 1Q2016.
Great Lakes – US and CAN
In the Great Lakes region, conifer wood fiber prices have been relatively flat since 3Q2015, appearing to have stabilized from the volatility experienced during 2Q2014-2Q2015. Delivered prices in 2Q2016 averaged USD$54.61/ton, a decline of USD$0.31/ton (0.6 percent) from 1Q2016.
Northeast US and Eastern CAN
In the Northeast US and Eastern Canada, prices increased slightly, though they remain low compared to previous years. Mill closures primarily in the Northeast US have led to the reversal of the long-term trend in pricing. Conifer wood fiber prices averaged USD$48.95/ton in 2Q2016, an increase of USD$0.72/ton (1.5 percent) from 1Q2016.
Delivered Hardwood and Eucalyptus Wood Fiber Prices
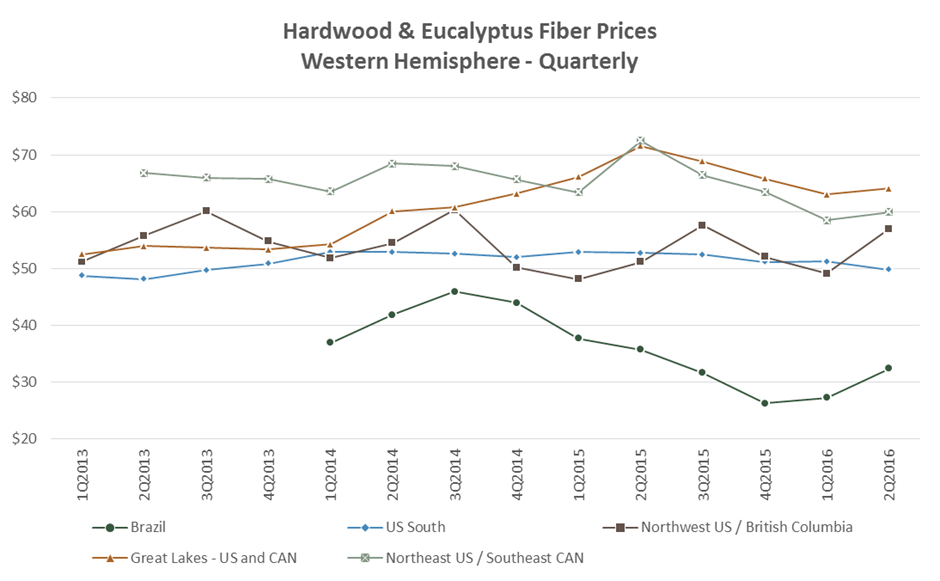
Hardwood and eucalyptus price trends were similar to conifer price trends in 2Q2016 with the exception of the Great Lakes region. There, prices increased due to the snow/ice breakup period in the spring months when logging and hauling restrictions limited supply and mills were forced to transfer pulpwood from remote storage yards. In this region, delivered prices increased USD$1.04/ton (1.6 percent) to average USD$64.05/ton.
The Northeast US/Eastern CAN and Northwest US regions experienced similar seasonality. Hardwood fiber prices in the Northeast US/Eastern CAN increased USD$1.41/ton (2.4 percent) to average USD$59.89/ton. In the Northwest US (which is a small hardwood market), prices increased USD$7.92/ton (16.1 percent) to average USD$56.98/ton.
The US South was the only region to experience a decline in hardwood fiber prices, where delivered prices averaged USD$49.79/ton, declining USD$1.44/ton (2.8 percent).
In Brazil, prices increased USD$3.65/ton (8.5 percent) for Eucalyptus wood fiber. Accounting for the exchange rate difference, prices increased USD$5.17/ton (19.0 percent) to average USD$32.40/ton.
To learn more about our Western Hemisphere and regional benchmarks, or to subscribe, contact us.
Methodology
For the Western Hemisphere Benchmark, we report stemwood (i.e. tree-length pulpwood or bolts) and wood fiber chips (wood fiber chips only, not energy chips) delivered through the supply chain to the end producer’s mill gate. We then convert the price and unit of measurement to US dollars/short ton. For stemwood, we also convert the product to a wood fiber chip equivalent and add a cost of five US dollars/green ton for debarking and chipping to the chip pile. We then compute a weighted average price for all combined wood fiber.


