
5 min read
The National Alliance of Forest Owners (NAFO) recently contracted Forest2Market to study trends in inventories and removals on privately-owned[1] timberlands[2] in forested areas of the contiguous United States to determine whether more wood is growing on US timberlands than is harvested.
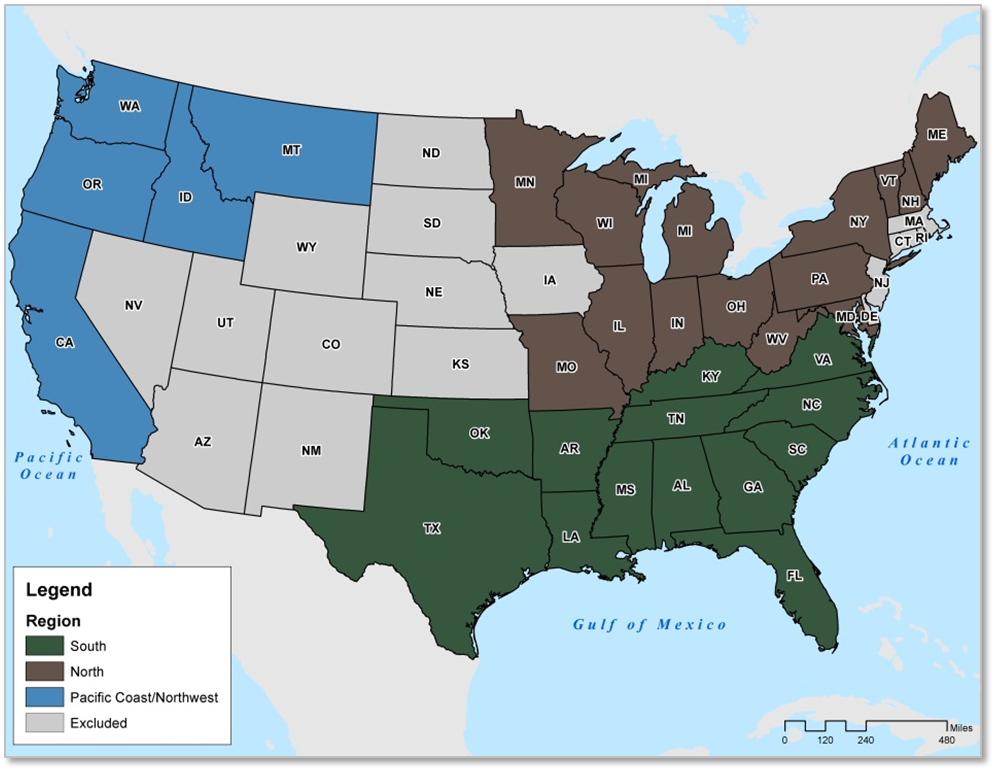
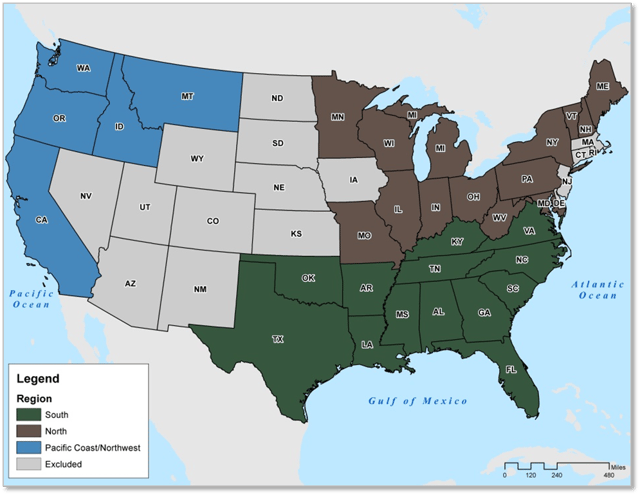
Forest2Market analyzed privately-owned timberlands in 32 states grouped into three regions: South, North and Pacific Coast/Northwest. By region, there were 13 states in the South, 14 in the North and 5 in the Pacific Coast/Northwest. The analysis covers the 2000-2014 time period in the US South and the 2008-2014 time period in all other regions.
National Trends: Total Inventory and Removals
In response to the economic downturn and subsequent impacts of the Great Recession, total harvest removals from privately-owned timberlands in the study area have decreased from 10.45 billion cubic feet (BCF) in 2008 to 10.11 BCF in 2014 at a rate of 0.6 percent compounded annually. Tree growth exceeded removals by an average of 40 percent during this period (GRR[3]=1.4), which resulted in a 6.2 percent increase in privately-held inventory (1.0 percent compounded annually) from 393.6 BCF in 2008 to 418.0 BCF in 2014.
Compared to the total available private timberland resource, very little is removed annually. In 2008, removals were equivalent to 2.7 percent of inventory. Driven by decreased harvest removals and increasing inventories, removals as a percentage of inventory fell to 2.4 percent of inventory by 2014.
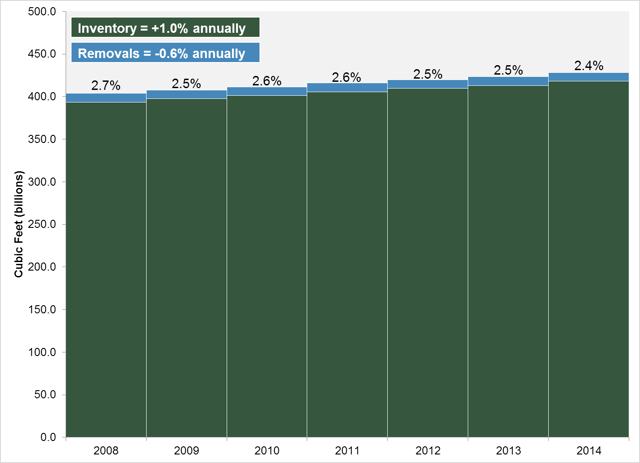
Total Removals Relative to Inventory, 2008-2014 – All Regions
Total Inventory and Removals by Region
South
The increase in total study area inventory between 2008 and 2014 was largely driven by increases in Southern inventories during this period. Total inventory in the South increased 8.1 percent from 231.7 BCF in 2008 to 250.4 BCF in 2014. Between 2000 and 2014, total inventory in the South increased 10.9 percent from 225.8 BCF to 250.4 BCF at a rate of 0.7 percent annually.
Total removals in the South declined 4.8 percent from 7.76 BCF in 2008 to 7.39 BCF in 2014. Between 2000 and 2014, total removals in the South decreased 12.4 percent from 8.43 BCF in 2000 to 7.39 BCF in 2014 at a rate of 0.9 percent annually.
In the South, an average of 23 percent more wood was grown than was harvested between 2000 and 2013 (GRR=1.23). Between 2008 and 2013, 41 percent more wood was grown than was harvested (GRR=1.41).
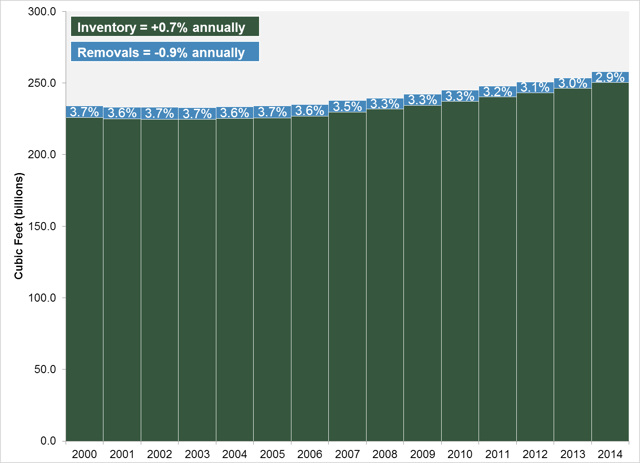
Total Removals Relative to Inventory, 2000-2014 – South Region
North
Total inventory in the North increased 2.7 percent from 76.3 BCF in 2008 to 78.3 BCF in 2014 at a rate of 0.4 percent annually. Total removals in the North declined 14.0 percent from 1.07 BCF in 2008 to 0.92 BCF in 2014 at a rate of 2.5 percent annually. Between 2008 and 2013, an average of 32 percent more wood was grown than was harvested in the North (GRR=1.32).
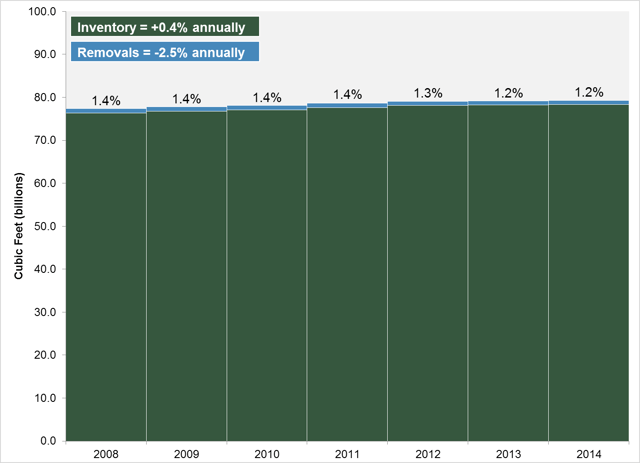
Total Removals Relative to Inventory, 2008-2014 – North Region
Pacific Coast/Northwest
Total inventory in the Pacific Coast/Northwest increased 4.4 percent from 85.5 BCF in 2008 to 89.3 BCF in 2014 at a rate of 0.7 percent annually. Total removals in the Pacific Coast/Northwest increased 11.3 percent from 1.62 BCF in 2008 to 1.80 BCF in 2014 at a rate of 1.8 percent annually. Between 2008 and 2013, an average of 42 percent more wood was grown than was harvested in the Pacific Coast/Northwest (GRR=1.42).
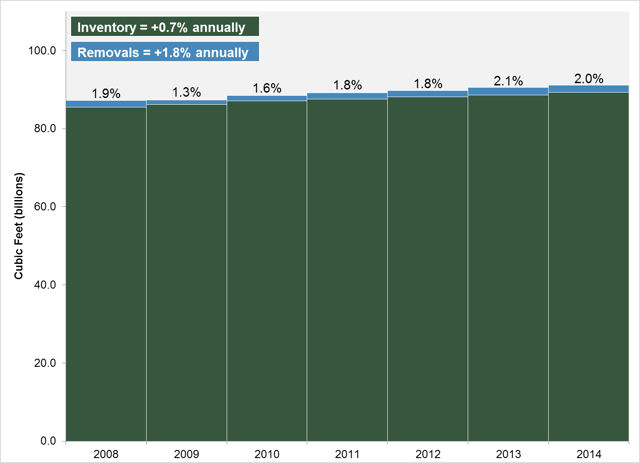
Total Removals Relative to Inventory, 2008-2014 – Pacific Coast/Northwest Region
Conifer/Pine Inventory and Removals by Region
Southern pine inventory increased from 86.8 BCF to 102.0 BCF at a rate of 2.7 percent compounded annually between 2008 and 2014. Northern conifer inventory increased from 37.3 BCF in 2008 to 39.6 BCF in 2014 at a rate of 1.0 percent compounded annually. Pacific Coast/Northwest inventory increased 0.8 percent annually from 72.1 BCF in 2008 to 75.6 BCF in 2014.
In the South, removals increased 0.2 percent compounded annually between 2008 and 2014 but averaged 5.25 BCF at both the start and end of this period. Northern conifer removals decreased 1.4 percent compounded annually from 0.54 BCF in 2008 to 0.50 BCF in 2014 due to paper mill closures and declining lumber production. In response to increased export demand for logs, Pacific Coast/Northwest conifer removals increased from 1.56 BCF in 2008 to 1.73 BCF in 2014 at a rate of 1.8 percent compounded annually.
Hardwood Inventory and Removals by Region
In the South, hardwood inventory increased 0.4 percent compounded annually from 144.9 BCF in 2008 to 148.4 BCF in 2014. Northern hardwood inventory decreased 0.1 percent compounded annually from 39.0 BCF to 38.7 BCF. Hardwood inventory in the Pacific Coast/Northwest region increased from 13.4 to 13.7 BCF at a rate of 0.3 percent compounded annually.
In the South, total hardwood removals decreased 2.7 percent compounded annually from 2.52 BCF in 2008 to 2.14 BCF in 2014. The decrease in total hardwood removals was more pronounced in the North, where hardwood removals decreased from 0.53 BCF to 0.42 BCF at a rate of 3.6 percent compounded annually. Hardwood removals in the Pacific Coast/Northwest increased at a rate of 2.7 percent compounded annually from 0.06 to 0.07 BCF.
Trends and Assessments
This analysis indicates that the Great Recession has caused several disruptions to harvest removal and inventory patterns on privately-owned timberlands in the study area. First, as demand for wood-based manufactured products has waned, the forest products industry in the United States is harvesting less wood than it did in 2008. Second, this reduction in harvest removals, especially sawtimber removals, has caused private forest inventories to increase above pre-Recession norms as unutilized sawtimber inventory accumulates. This trend is clearly evident in the South, where available FIA data make it possible to look at inventory trends both before and after the Great Recession, as shown in the figure below.
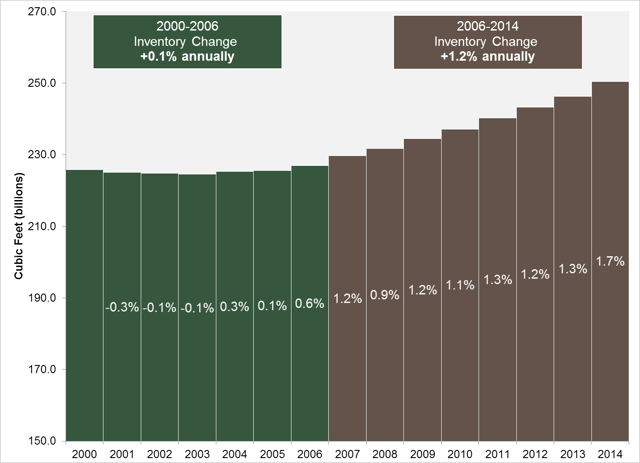
Total Inventory and Inventory Change, 2000-2014 – South Region
When demand for timber—especially high-value sawtimber—declines, private timberland owners feel pressure to optimize the return on their investment in one of two ways: the first is to delay sawtimber harvests, which increases inventories; the second is to seek alternate uses of their land that do not involve growing trees, such as converting it to agricultural land or selling it for development.
Robust, long-term demand for forest products promotes continued investment in forested lands and ensures that they remain forested. In the absence of that demand, as noted above, significant disruptions to forested land occur placing this land at risk for conversion to other uses. Converting these valuable lands to other uses negatively impacts America’s working forests and the industries that rely on them for raw material inputs, which are critical to local economies—especially in America’s rural areas.
For further details and regional breakdowns by product, read the full study on NAFO's website.

[1] Private owners include non-industrial private forest (NIPF) landowners (i.e., individuals, families, trusts, estates, and family partnerships), corporate entities (e.g., Timberland Investment Management Organizations (TIMOs), Real Estate Investment Trusts (REITs), and integrated forest products companies), Native Americans, non-governmental conservation/natural resources organizations and unincorporated local partnerships, associations or clubs.
[2] The U.S. Forest Service classifies any forest capable of producing 20 cubic feet of wood per acre per year at culmination of mean annual increment as “timberland.” This category excludes reserved forestland, which will never be subject to harvest.
[3] The growth-to-removal ratio (GRR) reflects the extent to which growth outpaces removals or vice versa. The GRR is calculated by dividing growth by removals. If the result is over 1.0, more wood was grown than was removed during that time period. If it is less than 1.0, more wood was removed than was grown. This figure also describes the extent to which growth outpaces removals. For example, a GRR of 1.33 means that growth outpaced removals by 33 percent whereas a GRR of 1.06 means that growth outpaced removals by 6 percent.


