
The global forest community and forest products industry are beginning to change the anti-forestry narrative that has so dominated the news cycles for decades. This is progress that is long overdue. Rather than approaching the educational and outreach efforts with a haggard reliance on emotionally-driven images (that are but a snapshot in time and do not reflect forest life cycles), the forest industry has tangible, positive data on its side. Proof always wins in the end, and the overall health and sustainability of America’s forests is best represented in the fact-based conversation that is occurring now.
A number of organizations advocating for, and operating within the forest industry have contributed to the ongoing conversation about the improving wellbeing of our forests. Organizations like the National Association of Forest Owners (NAFO), the newly-formed North American Forest Partnership (NAFP) and the Biomass101 initiative — and many other partners from every part of the forest value chain — are involved in telling these stories from their own unique perspectives. The case is made time and time again, with the support of reliable data, that America’s forests are flourishing.
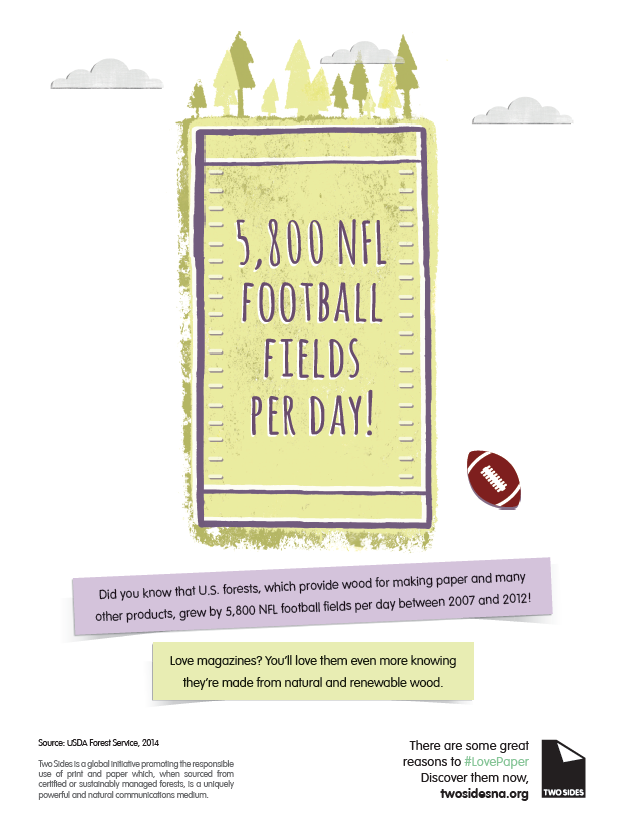
Two Sides North America, an organization promoting the sustainability of both the graphics communications industry and forest resources, recently released a creative piece of messaging that uses spatial comparisons to illustrate the significance of this data. Per the message titled “Some Thought-Provoking Analogies on Paper, Forests and Recycling,” Two Sides North America President Phil Riebel notes:
- Forest area in the U.S. increased by 5,800 NFL football fields per day between 2007 and 2012.[1]
- The volume of wood (trees!) on U.S. timberland increased by the equivalent of 159 Empire State Buildings per year between 2007 and 2012.[2]
- In 2015, the U.S. recovered enough paper (for recycling) to fill 125 Empire State Buildings.[3]
- From 2005 to 2015, U.S. forests stored the equivalent in carbon to taking 137 million cars off the road each year.[4]
The campaign also includes a visual element (below) developed for Two Sides publisher partners, who also help to promote the positive environmental story of sustainable forest management and the forest products industry.
 As the forest community begins to join the conversation and combat the many misconceptions that are so pervasive in today’s media, this is the kind of proactive, confident storytelling that will ultimately lead to education about the sustainable value of our forests.
Sources:
[1] Forest area grew by 14 million acres between 2007 (752 million acres) and 2012 (766 million acres) (USDA Forest Service, 2014). A full football field including the end zones is 360 ft by 160 ft or 1.32 acres (http://www.sportsknowhow.com/football/field-dimensions/nfl-football-field-dimensions.html). Forest area grew by 10.6 million football fields (14 million acres of forest area/1.32 acres in a field) in five years = 2.1 million per year = 5,811 football field per day.
[2] Net volume growing stock on timberland in the U.S. grew from 942,949 to 972,397 million ft3 between 2007 and 2012 (USDA Forest Service, 2014) - an increase of 29,448 million ft3 = 5,890 million ft3 per year = 16 million ft3 per day. The volume of the Empire State Building is 37 million ft3 (http://www.esbnyc.com/sites/default/files/esb_fact_sheet_4_9_14_4.pdf )
[3] Recycling one ton of paper saves 3.3 cubic yards (89.1 cubic feet) of landfill space (http://www.isri.org/docs/default-source/commodities/fact-sheet---paper.pdf ). Empire State Building = 37 million ft3 (its space saves 415,264 tons of paper). Paper recovery data was obtained from www.paperrecycles.org .
[4] A conventional gas vehicle in the U.S. emits 2,720 lbs of carbon (10,000 lbs of CO2 eq. per year) (https://www3.epa.gov/otaq/consumer/420f08024.pdf ). There are 2204.62 lbs/metric tonne therefore an average car emits 1.23 metric tonne of carbon/y. Between 2005 and 2015, carbon stock in the forest rose from 87,271 to 88,961 million MT of carbon - an increase of 1,690 million MT over 10 years or 169 million MT/y (equivalent to 137 million cars) (https://www.epa.gov/sites/production/files/2016-04/documents/us-ghg-inventory-2016-main-text.pdf - Table 6-12)


