
 Daniel Stuber
By comparing average mill costs to average market costs along a volume curve, a mill can achieve lower wood costs. How does this supply chain optimization powerhouse work?
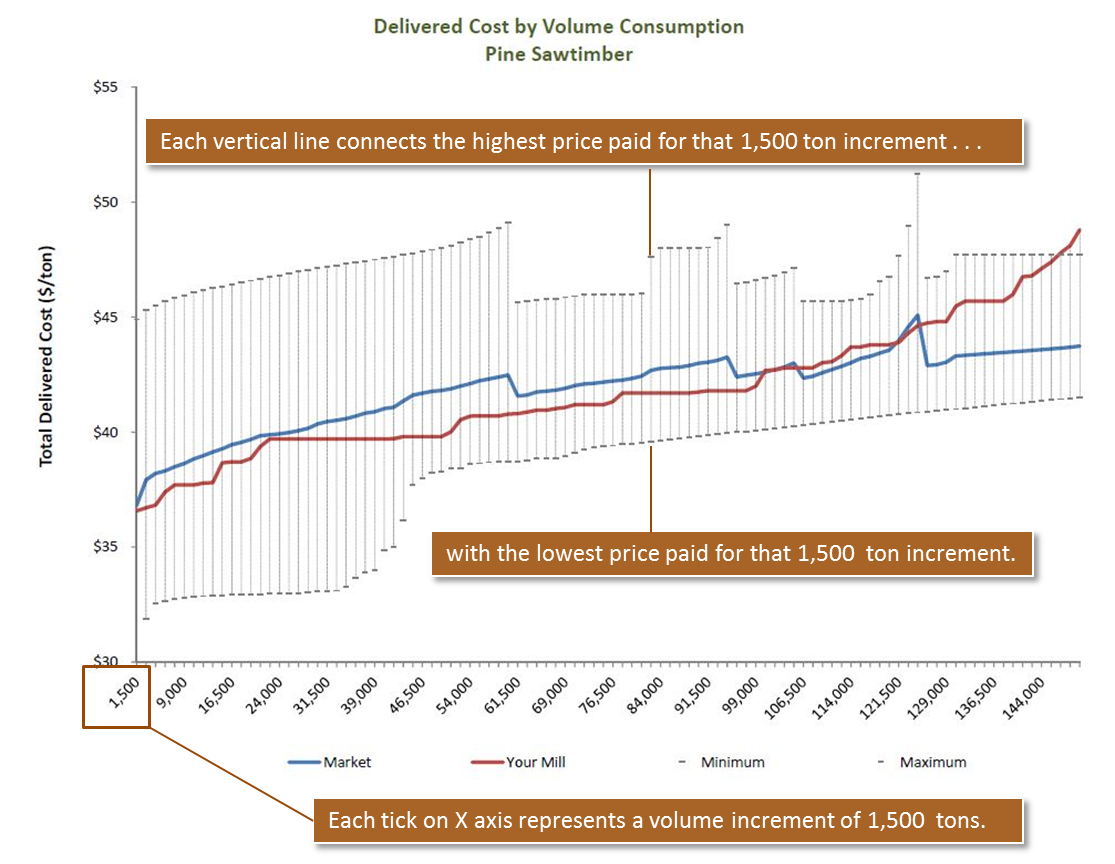
How to Read a Cost Curve
The first tick represents the lowest cost percentage of volume (in this case, 1,500 tons) consumed in the period by both the mill (red line) and the market (blue line).
- The last tick represents the highest cost 1,500 tons consumed in the period.
- The vertical lines on the chart connect the maximum and minimum prices paid for that 1,500 ton increment. The market average falls in between.
The following cost curve for pine sawtimber shows the volume increments where wood was purchased both above and below the market average. Every increment in which a mill’s cost is above the minimum is a potential cost savings opportunity.

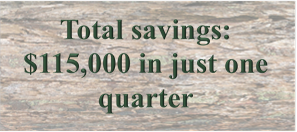
Even when this mill is purchasing below market, as is the case for the first 40,000 tons here, there is considerable room for improvement. By lowering the cost of these 40,000 tons by $1/ton, $40,000 can be saved, just in one quarter.

The highest cost 25,000 tons are significantly above market. By understanding what loads make up these last increments, a mill would have options for saving costs:
- If the last 25,000 tons were all delivered under the same supply agreement, this agreement could be renegotiated to bring it more in line with the market average. A savings of $3/ton would bring the cost for these tons to market average and save the mill $75,000 in wood costs.
- Because the last 10,000 tons are significantly out of line with the rest of the market, the mill might benefit from avoiding the incremental production associated with those loads to save money.
 Source of data: Forest2Market's US South Delivered Price Benchmark Service.


