
 Suz-Anne Kinney
I read with interest a recent announcement by the State of South Carolina concerning its update of the state's best management practice (BMP) compliance rates. Guy Sabin, the SC Forestry Commission’s Environmental Program Manager, proudly exclaimed that the state had “a stunning 98 percent compliance with the guidelines” set out in its best management practice program. A little research into the records of states with significant forest products industry activity shows that many have a compliance rate higher than 90 percent. In fact, states with the most robust harvest activity often have the highest levels of compliance.
Best management practices are those guidelines set out by states to ensure compliance with the Clean Water Act.* These practices are outlined in detail and widely available, as is the the training required for implementing the practices.
Specific to harvest conditions in a state, BMPs protect bodies of water through the definition of Streamside Management Zones (SMZs) or Riparian Management Zones (RMZs), or strips of land adjacent to streams or other bodies of water in which forestry operations may impact water quality. BMPs determine the size of the zones and the practices that should be undertaken to minimize pollution. The guidelines also specify practices for constructing stream crossings, forest roads and skid trails. In addition, BMPs sometimes include limits on fertilizers and pesticides as well as waste disposal.
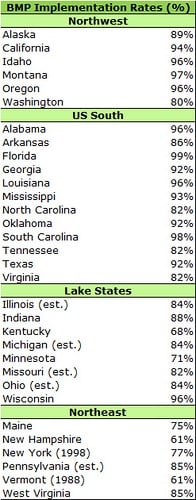
The following chart outlines compliance levels for 32 states with significant forest resources and harvest activity. With the exception of the South Carolina figure, the numbers come from "Trends for Forest Best Management Practices Implementation,” which was published by the Journal of Forestry in Sept. 2010.
The Pacific Northwest has the highest level of compliance, with an average of 92 percent. The South follows with an average of 91 percent. The Lake States have an 82 percent compliance rate on average, and the Northeast has the lowest rate at 72 percent. It should be noted that despite the Lake States’ average number, Wisconsin has one of the highest rates at 96 percent. In the Northeast, the numbers in the table may be significantly lower than actual. Vermont’s number, for instance, has not been updated since 1988.
Overall, the high compliance rates in most states demonstrate that the forestry industry has done a very good job of protecting the water sources in forested areas. For companies contemplating opening new operations, choosing sites in states with the highest implementation of best practices can minimize the amount of risk associated with water pollution. States with implementation rates higher than 90 percent include Wisconsin, California, Idaho, Montana, Oregon, Alabama, Florida, Georgia, Louisiana, Mississippi, Oklahoma, South Carolina and Texas. States with implementation rates between 80-89 percent include Illinois, Indiana, Michigan, Missouri, Ohio, Pennsylvania, West Virginia, Arkansas, North Carolina, Tennessee, Virginia, Alaska and Washington.
If you've seen updated numbers for any of the states listed here, please let our readers know by leaving a comment.
*Enacted in 1972, the Clean Water Act had significant ramifications for forest and harvest management practices. For the first time, the act required non-point sources (NPS) of water pollution to take proactive steps to minimize the effects of operations on water quality. According to the US Environmental Protection Agency (EPA):
Nonpoint source pollution generally results from land runoff, precipitation, atmospheric deposition, drainage, seepage or hydrologic modification.
The term "nonpoint source" is defined to mean any source of water pollution that does not meet the legal definition of "point source" in section 502(14) of the Clean Water Act. That definition states: The term "point source" means any discernible, confined and discrete conveyance, including but not limited to any pipe, ditch, channel, tunnel, conduit, well, discrete fissure, container, rolling stock, concentrated animal feeding operation, or vessel or other floating craft, from which pollutants are or may be discharged. This term does not include agricultural storm water discharges and return flows from irrigated agriculture. (The second post in this series will look at point sources of pollution.)
States report that nonpoint source pollution is the leading remaining cause of water quality problems. The effects of nonpoint source pollutants on specific waters vary and may not always be fully assessed. However, we know that these pollutants have harmful effects on drinking water supplies, recreation, fisheries and wildlife.
Sediment from improperly managed forests is considered a nonpoint source of pollution. Following the enactment of the CWA, states were required to comply with the law. In response, 44 states have recommended or required best management practices (BMPs) for forestry related activities to ensure compliance with the CWA.
For an overview of BMPs by region, we recommend the National Council for Air and Stream Improvement’s (NCASI), “Compendium of Forestry Best Management Practices for Controlling Nonpoint Source Pollution in North American.”
Comments
12-05-2011
North Carolina Update: 85% statewide implementation of forestry BMPs
- Source: 2006-2008 survey of forestry BMP implementation published in 2011; download here (http://ncforestservice.gov/water_quality/wq_bmp_studies.htm).
Comments
12-05-2011
Thanks, David. I’ll update the table to reflect this information.
Comments
12-07-2011
Thanks Suz-Anne, nice write up. The data for Florida is correct.
Comments
12-08-2011
Tennessee Update: 89.2 % implementation rate statewide for forestry BMPs.
Source: Implementation of Forestry Best Management Practices in Tennessee: Results From the 2007 Forestry BMP Implementation Survey (published in 2009).
Copy available form following link: http://www.tn.gov/agriculture/publications/forestry/BMP_Booklet.pdf
Comments
12-08-2011
Georgia Update:
The Statewide BMP implementation rate for Georgia is now 94.2 percent.
Source: Results of Georgia’s 2009 Silvicultural BMPs Implementation and Compliance Survey, published in 2010. A copy is available at this link:
http://gatrees.org/Resources/documents/2009BMPSurveyResults.pdf
Comments
12-09-2011
Arkansas Update: 89% statewide forestry BMP implementation rate.
Source: “Voluntary Implementation of Forestry Best Management Practices for Water Quality Protection in Arkansas - Results of the 2010-2011 BMP Implementation Survey” (published 2011). A copy is available on our at website at the link below:
http://forestry.arkansas.gov/Services/ManageYourForests/Documents/2011_Monitoring_Report_small.pdf
Comments
Steven W. Koehn, MD State Forester
12-09-2011
The most recent Maryland BMP report can be found at the following website:
http://www.dnr.maryland.gov/forests/pdfs/MDForestBMPResults2006.pdf
Comments
12-10-2011
nope not so in alabama,clearcuts from the 1970s are being cleared in strepes,plus fixed wing pesticide spraying everywhere streams,ponds,yards,house tops, and me the owner of one.And then chopper sparyed herbicide a little more closely guarded but still killing my hard wood on a fencerow,huckleberry almost extente so it screw the balance,im guessing the planted pines are only male lobloly the pollen is thick in the spring and not one cone ever,I know theres no money in cones.The pollen last about 31/2 months and does get deep on cars and such not to mention how sick folks get with alageres.
randy lanier looking for spell check
Comments
12-15-2011
Texas Update: 94.1%
Source: Voluntary Implementation of Forestry Best Management Practices in East Texas, December 2011. A copy is available on our website at the link below.
http://txforestservice.tamu.edu/uploadedFiles/FRD/Best_Management_Practices/RD 8 BMP Implementation Report - web.pdf


