
 Joe Clark
An accurate stumpage price forecast is a vital tool to help overcome budget challenges and aid in procurement decisions. The precision of a stumpage price forecast increases when prices are reported based on diameter at breast height (DBH) measurements. Since the average DBH of a mill’s monthly purchase volume is different than its competitors and even its own previous month’s purchases, it is important that forecast users know how to apply stumpage forecast numbers to other DBHs.

Forest2Market’s stumpage price forecast uses a 10” DBH benchmark for chip n saw and a 14” DBH benchmark for sawtimber. These prices can be converted so they apply to other diameters using either a quick dollar/inch calculation or a more precise regression analysis.
Dollar/Inch Value
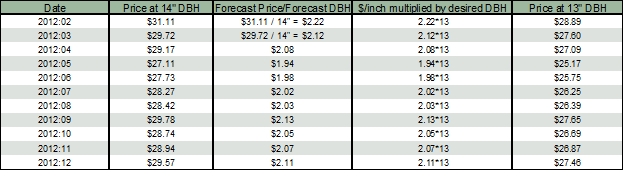
In Figure 1 below, monthly data at the 14” sawtimber benchmark is presented. Since we know the starting price and DBH, we can easily calculate the dollar/inch value by dividing the forecasted price by the benchmark DBH to determine price at a 13” DBH.
To determine the dollar/inch value in this case, the formula Price/DBH is employed, where price is the dollar amount for a given month and 14 is the benchmark DBH. Once the dollar/inch value is known, simply multiply by the desired benchmark DBH to calculate the expected price at the desired DBH. While not a perfect solution, this is a quick and easy way to convert prices to various benchmark DBHs.
The complete formula: (Forecast Price / Forecast DBH) x Desired DBH
Figure 1. Original forecast price at DBH 14”, along with conversion calculations from forecasted price at 14” DBH to price at 13” DBH.
Regression Analysis
A more complex regression analysis can be used to produce additional accuracy. Here at Forest2Market we are able to use our stumpage database, which consists of tract-level sales data, to perform this more sophisticated calculation.
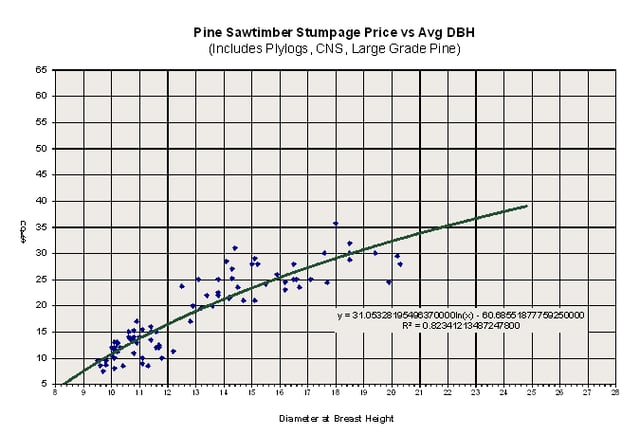
We can use this data to analyze DBH/Price relationships for any given area (Figure 2). Here, represented by the solid line, a logarithmic trend line is fit to the data. This trend line allows us to accurately predict average price down to a 1/10” interval for any DBH. We can then use this more accurate price at the desired benchmark DBH to run the forecast.
Figure 2. Graph showing an analysis of the relationship between DBH and price using regression analysis.


