
 Suz-Anne Kinney
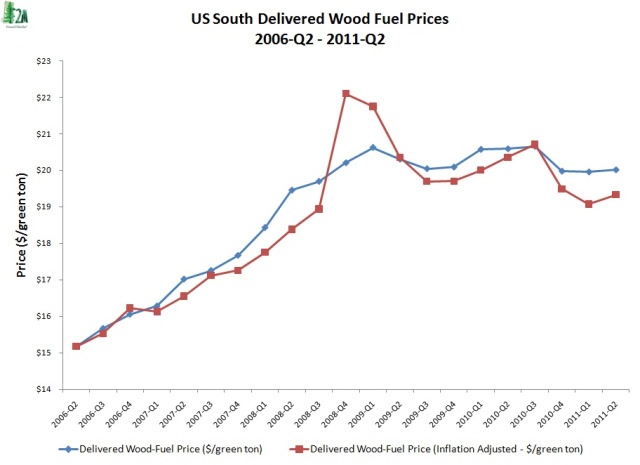
Since the 2Q2006 inception of Forest2Market’s delivered price benchmark for Southern markets, real wood fuel prices have trended higher, gaining $4.16/green ton or 27.4%. As Figure 1 shows, a majority of this increase occurred between 2Q2006 and 4Q2008, when prices climbed $6.93/green ton or 45.7%. After the 4Q2008, prices began a correction, dropping $2.77/green ton or 12.5%.
In order to isolate the drivers of the trends in wood fuel pricing we’ve seen during this period, I correlated a series of data points that I thought might have been statistically significant to pricing. Because we’re looking at trends over the last five years, these data points are heavily influenced by the fact that the largest producer of biomass power in the US during that period has been the pulp and paper industry. The major factors I looked at include :
- Pine pulpwood consumption—assuming the increase/decrease in pulpwood volume that a mill consumes and thus debarks for its wood boiler would have an impact on the additional amount of wood fuel it needs to meet its energy requirements.
- Pine sawmill residual chip consumption—assuming the increase/decrease in the residual chip volume purchased in the market would be a barometer for the increase/decrease in sawmill bark production or supply available to pulp mills.
- Industrial natural gas prices—assuming some mills buy natural gas to supplement biomass electricity, and that the alternative to burning wood fuel is buying natural gas.
- Industrial electricity prices—assuming some mills buy electricity to supplement biomass electricity, and that the alternative to burning wood fuel is buying electricity.
- Transportation costs—assuming increases/decreases in diesel costs and/or haul distances affect the cost of wood fuel.
- Incentive policies—assuming that the Biomass Crop Assistance Program and the Black Liquor Tax Credit influenced the market and led to increases/decreases in wood fuel prices.
I then tested for significance using step-wise selection, and the three variables that showed statistical significance were 1) pine sawmill residual chip consumption volume, 2) industrial electricity prices, and 3) industrial natural gas prices. Figure 2 places all of these variables on a single chart in order to demonstrate their effect.
Figure 2
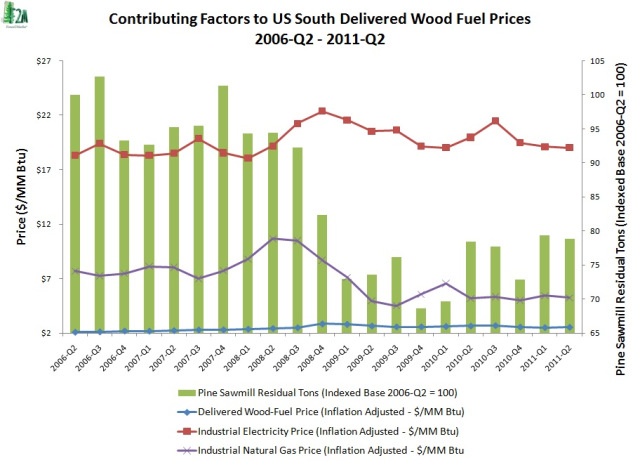
In Figure 2, the green bars represent the volume of sawmill residual chips, and the lines represent energy prices. Because the price of wood fuel per MM BTU is significantly lower than the cost of the other energy sources, however, I then adjusted the cost of wood fuel (to a $ per $10/MM BTU scale) in order to compare the increases/decreases in wood fuel prices to the other factors (see Figure 3).
Figure 3
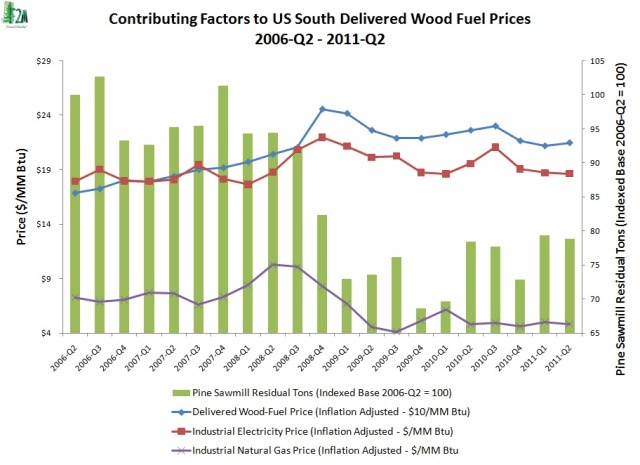
In 2Q2006, the wheels were coming off the housing market. In the following quarters, we saw a decline in the supply of sawmill residual chips as lumber production declined. During this same timeframe, we saw a slow steady increase in the cost of wood fuel. The most significant movement occurred in 4Q2008, when sawmill residual supply dropped 11% from the previous quarter and wood fuel prices increased by 17% (quarter over quarter). Through most of 2008, both electricity and natural gas prices were increasing; electricity gained 22.7% and natural gas prices gained 13.3%. This caused mills to substitute wood fuel whenever they could, which also put upward pressure on demand for wood fuel.
After the 4Q2008 spike in wood fuel prices, a correction ensued. Electricity and natural gas prices fell, electricity by 13.5% and natural gas by 27.7%, and mills cut back on wood fuel consumption. Though the average production of sawmill residual chips from 1Q2009-2Q2011 is 21% lower than it was in 2Q2006-4Q2008, production has actually increased 8.2% since the beginning of 2009.
We’ve certainly reached a new trend line in wood fuel pricing: the average cost per MM BTU from 2Q2006-4Q2008 was $1.95; from 1Q2009-2Q2011, that price averaged $2.25. Where will wood fuel prices go from here? Because the housing market will continue on its path for an achingly slow recovery, residual chip supplies will remain steady, so we don’t except anything constrained supply of residual chips to drive wood fuel prices higher. On the demand side, the possibility of a double-dip recession could lead to lower wood fuel prices. Many expect that this double dip is on the horizon. If it happens, electricity and natural gas demand and prices will fall, causing downward pressure on wood fuel prices. Higher demand as biomass power capacity increases could have an opposite effect. The number of biomass power facilities is slowly growing. Among those currently scheduled to begin operations, for instance, is Aspen Power, which recently finished test burns and has begun scaling up. As the facilities currently under construction come online, wood fuel prices will continue their upward trend.
Comments
Five-Year US South Delivered Wood Fuel Price Trend
09-08-2011
[...] South Delivered Wood Fuel Price Trends September 8, 2011 - 0 Comments By Daniel Stuber – Forest2Market Graphs by Daniel Stuber – [...]
Comments
Wood Fuel Prices – 2Q2012 | F2M Market Watch
08-15-2012
[...] Fuel Prices – 2Q2012 Posted on August 15, 2012 by Daniel Stuber Last August, we predicted that the US South was on a new trend line for wood fuel prices. Now, one year later, data from the first half of 2012 appears to be further substantiating our [...]


