 Suz-Anne Kinney
Forest industry performance in October and November was reported by both the US government and the Institute for Supply Management.
Industrial Production
Total industrial production (IP) took a breather in October, edging down 0.1% after an 0.8% advance in September. Total IP in October was 4.0% above its level of a year earlier. In addition:
- Manufacturing output increased 0.2% for a second month. Motor vehicle and parts production, by contrast, dropped for a third month—the worst consecutive run since January 2009.
- Wood Products output rose by 0.8%, reversing September’s -0.6%. Paper fell 0.2% after being unchanged in September.
- Construction gained 0.2%, extending September’s +0.5%.
- Consumer goods dropped by 0.2%, partially offsetting September’s +0.4%.
Capacity at the all-industries and manufacturing levels expanded by, respectively, 0.3 and 0.2%. Wood Products extended its ongoing upward trend (since July 2013) when increasing by 0.4%. Paper, on the other hand, contracted by 0.2% to another new low.
Capacity utilization for all industries, which has flattened just shy of its pre-recession high, decreased 0.4% in October to 78.9%. Wood Products and Paper, both of which have also plateaued, rose by 0.3 and 0.1%, respectively. Combining the trends in both capacity and capacity utilization reveals the Wood Products sector is expanding while the Paper sector is gradually fading.
Manufacturing and Non-manufacturing
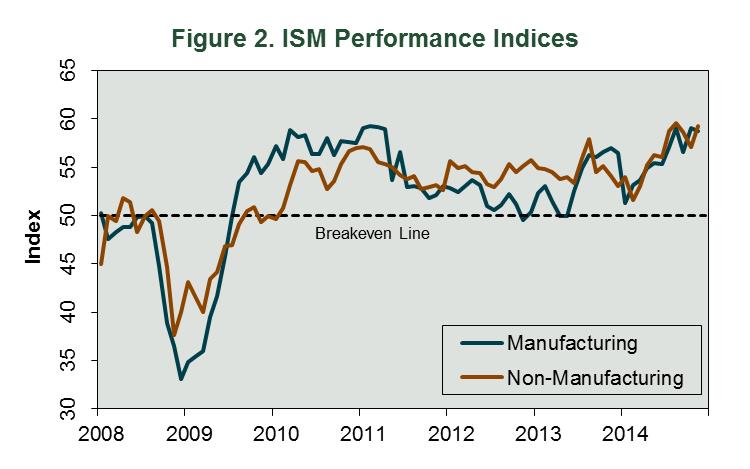
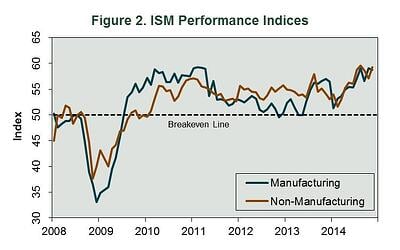
The Institute for Supply Management’s (ISM) monthly opinion survey showed that economic activity in the U.S. manufacturing sector expanded at roughly the same pace in November as in October. The PMI edged down 0.3 percentage point, to 58.7% (Figure 2). The expansion was supported by increased new and backlogged orders, imports and exports, and slower supplier delivery times (implying suppliers may be having difficulty keeping up with orders).
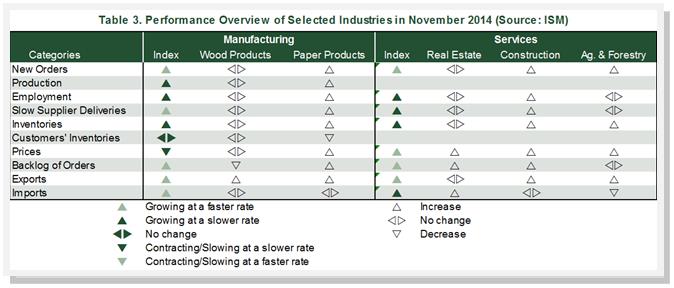
Wood Products was unchanged again in November (Table 3), as increased export orders were offset by declines in backlogged orders; the lumber market has “remained strong going into year-end,” one respondent indicated, however. Paper Products’ expansion, by contrast, exhibited widespread support among the sub-indices.
The pace of growth in the non-manufacturing sector quickened in November, nearly recapturing the high set back in August. The NMI registered 59.3%, a gain of 2.2 percentage points; only the employment and imports sub-indices were lower in November than in October.
Two of the three service industries we track (Construction and Ag & Forestry) reported expansion in November. The increases in imports and backlogged orders were not enough to move Real Estate’s overall activity “meter.”
While ISM’s November PMI and Markit’s U.S. Manufacturing PMI moved in parallel (i.e., both showed slower expansion), ISM’s NMI and Markit’s U.S. Services PMI diverged (i.e., ISM expanded more quickly, Markit more slowly).
ISM’s reports are useful as attitudinal barometers, but they are not a substitute for “hard” data. For example, ISM has reported Paper Products expanded during 22 of the past 24 months. That does not square with Federal Reserve Board data, which shows paper IP and capacity, respectively, 2.1% and 3.6% lower than in November 2012. ISM’s results for Wood Products (expansion during 16 of 24 months) are consistent with Fed data (IP: +17.0%; capacity: +4.0%), however.
This post is an excerpt of Forest2Market's Economic Outlook. Last month's excerpt: Forestry-Related Industry Perfomrance: October 2014.