Forest2Market recently released Timber Supply Analysis 360, an interactive tool that provides fast, streamlined access to the USFS Forest Inventory and Analysis data on growth, inventory and harvests. It also provides access to harvest data in the Pacific Northwest from the Bureau of Business and Economic Research (BBER), Oregon Department of Forestry (ODF) and the Washington Department of Natural Resources (WADNR). Timber Supply Analysis 360 is the only tool that allows you to access all of this data in a single platform.
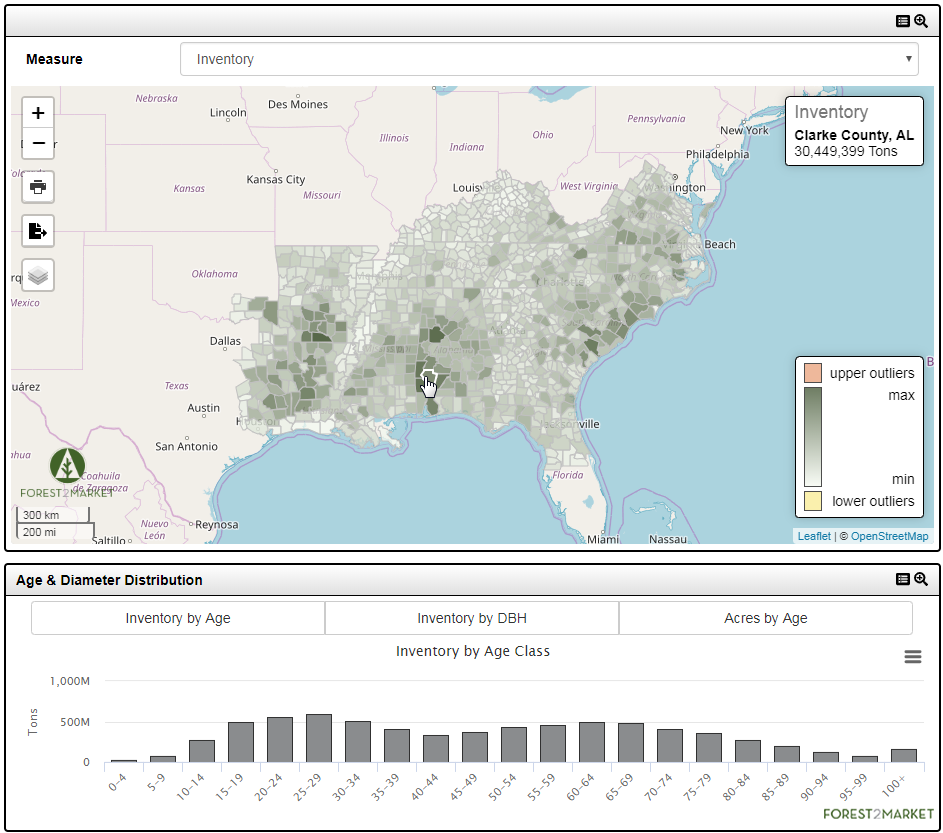
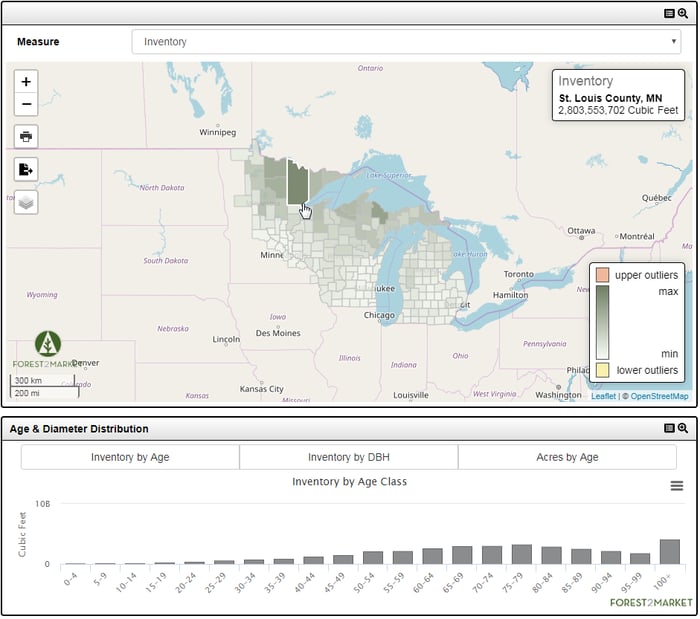
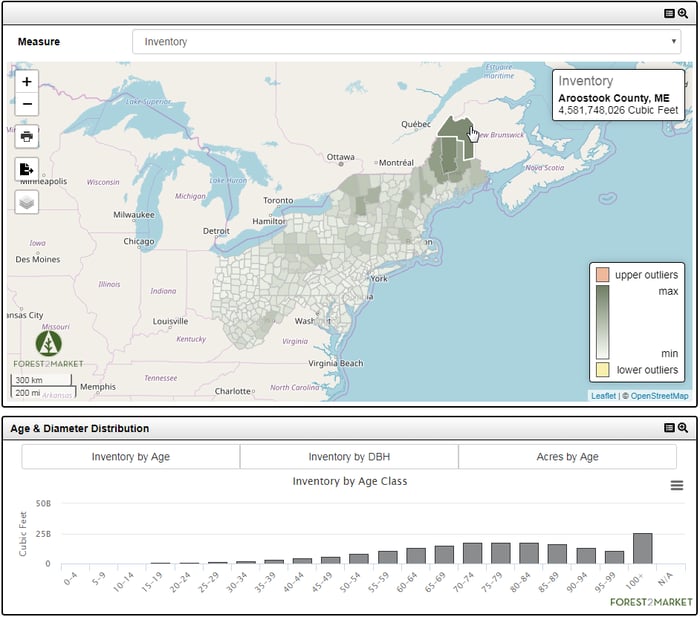
One of the ways you can analyze this data is on a color-coded heat map that distinguishes between high and low numbers. The following maps show total forest inventory for each region of the United States. The selection of a single county displays the value. The charts that follow each map break this inventory down by age class.
US South
Lake States
Northeast
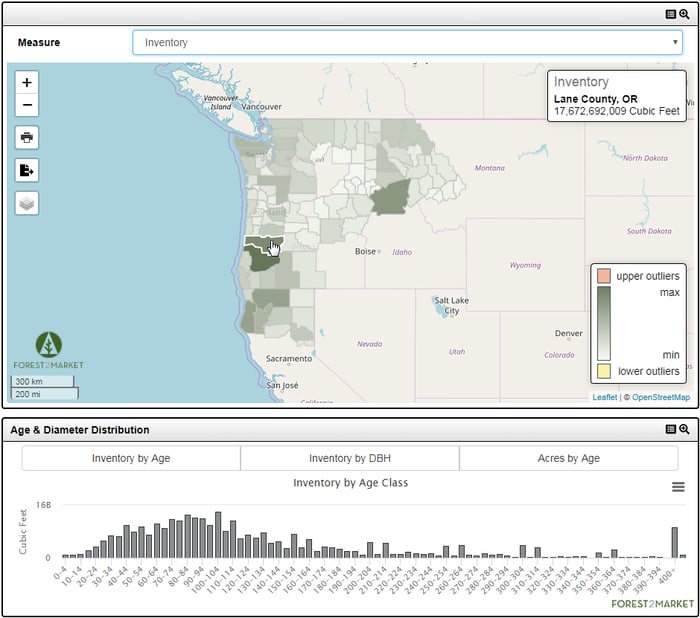
Pacific Northwest
In addition to inventory, the maps will also display:
- Acres/Land Acres
- Growth
- Removals
- Growth/Removals
- Inventory per Acre
- Growth per Acre
- Growth/Inventory
- Removals per Acre
- Removals/Inventory