
 Joe Clark
Forecasts, no matter the subject matter, are difficult things to produce. When it comes to timber prices, many local factors—such as the weather and mill demand—and the broader economy—such as GDP and oil prices—influence prices. Both local and national factors can be volatile, making it difficult to predict how their combined influences will affect stumpage prices as a whole over extended periods.
What sets one forecast apart from another is the quality of data used to develop it. Adjusting a forecast built on poor quality data, no matter how dead-on those adjustments may be, will not change the quality of the forecast. A forecast developed out of sub-par data, will produce at best a sub-par forecast.
Forest2Market’s stumpage prices are based on tract level, transactional timber sales that are reported to us through numerous wood dealers, loggers, consultants, forest product companies, TIMOs and RIETs on a daily basis. By collecting data in this form, we are able to keep up with local markets in real time, providing the most accurate stumpage prices available.
One thing we do not do is produce just one 24-month forecast every two years. Things change too quickly. Instead, we adjust the forecast model to account for changes in the various factors that affect prices throughout the forecast period. And we do this four times a year, or eight times in every 2-year forecast period. As a result, we expect our forecasts to improve consistently over time, becoming more precise and accurate with each new one we produce.
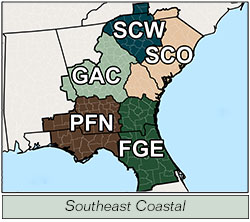
Let’s look at why re-forecasting the numbers on a continuing basis is necessary. Forest2Market produces a forecast for the Southeast Coastal (SEC) region (Figure 1), for instance, every three months.

Figure 1.Map of SEC region and sub-regions. Prices shown in Figures 2 and 3 are weighted averages on a region wide basis.
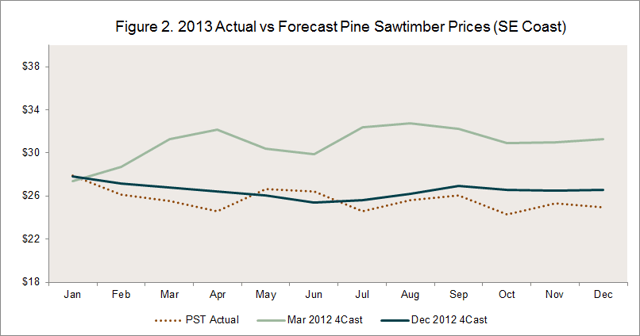
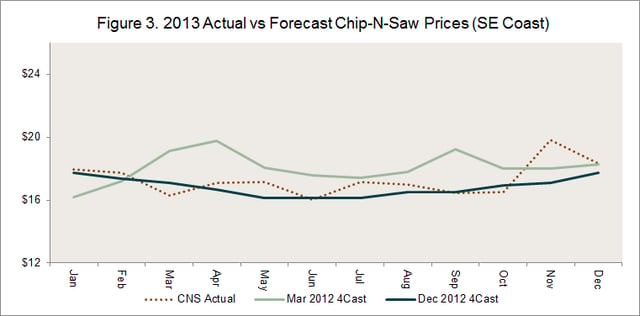
Figures 2 and 3 compare actual monthly sawtimber and chip-n-saw prices across two forecasts: one produced 9 months prior to 2013 (March 2012) and the second produced only a month prior to 2013 (December 2012). As expected,our December 2012 forecast for each product produced a more accurate picture of prices during 2013.
The December 2012 pine sawtimber forecast showed a significant change over the March 2012 version. In March of 2012, most analysts projected significantly higher housing starts for this period. Though we had a slightly more modest view of the recovery, sawtimber prices in the March 2012 forecast were higher than the actual. Why? As we moved through 2012, signs began to appear that new home construction would stall, holding sawtimber prices at bay during the upcoming year. This new information required that we adapt our model, and the adaptations resulted in a more accurate picture of 2013 prices, as is clear when the Actual line is compared to the blue December 2012 line in Figure 2.
The chip-n-saw price forecast from March 2012 was also higher than the actual price observed throughout the year. This forecast rode the coat tails of sawtimber. With housing expected to continue improving, the mindsetwas that mills would begin to purchase smaller sized logs to keep up with demand. Once again, the December forecast was adjusted to the more obvious reality of a slumping housing market recovery. The result was a more precise and accurate view of the market with each successive forecast, as is clear when the Actual line is compared to the blue December 2012 line in Figure 3.
Forest2Market understands that no business should rely on a single forecast for a view of prices two-years out or five years out, which is why we produce regular forecasts that adjusted to accommodate new information and updated pricing. Because natural occurrences like rainfall or hurricanes and global economic events are difficult to predict, a good forecast should be one that changes as circumstances do.
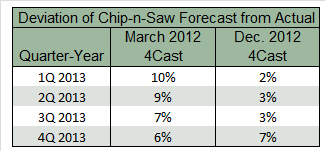
When measured against actual timber prices, these successive forecasts increase the accuracy of prices so that subscribers can update and re-run their own proprietary forecasts. Table 1 summarizes the degree of accuracy that can result from this type of forecast process. The percentage difference between actual and forecast prices between the March and December forecast shows that three quarters can make a big difference in the accuracy.
Rarely will a forecast be dead on. Using a regularly updated forecast to make business decisions, however, will close the gaps on the unknowns that can plague one-time timber price forecasts, whether they are for one year or five.


