
 Suz-Anne Kinney
After edging up by 0.1% in October (revised from -0.1%), the seasonally adjusted industrial production (IP) index gained another 1.1% in November. The bulk of November’s gain is attributable to utility output, thanks to colder temperatures. Performance of major sub-groups was as follows:
- Manufacturing advanced by 0.6%, besting October’s +0.5%. Manufacturing remained 3.6% below its pre-recessionary peak, however.
- Wood Products gained 3.1%, handily beating October’s 0.8% increase.
- Paper rose by 0.2%, slowing from October’s 0.8% increase.
- Construction was unchanged at 0.6%.
- Consumer Goods jumped by 1.5%, reversing October’s 0.1% decline.
Capacity utilization of all industries increased 0.8% in November (to 79.0%); both Wood Products (3.1%) and Paper (0.3%) expanded. Capacity among all industries nudged 0.2% higher in November; once again, Wood Products was unchanged while Paper shrank by 0.1%.
Manufacturing and Non-manufacturing
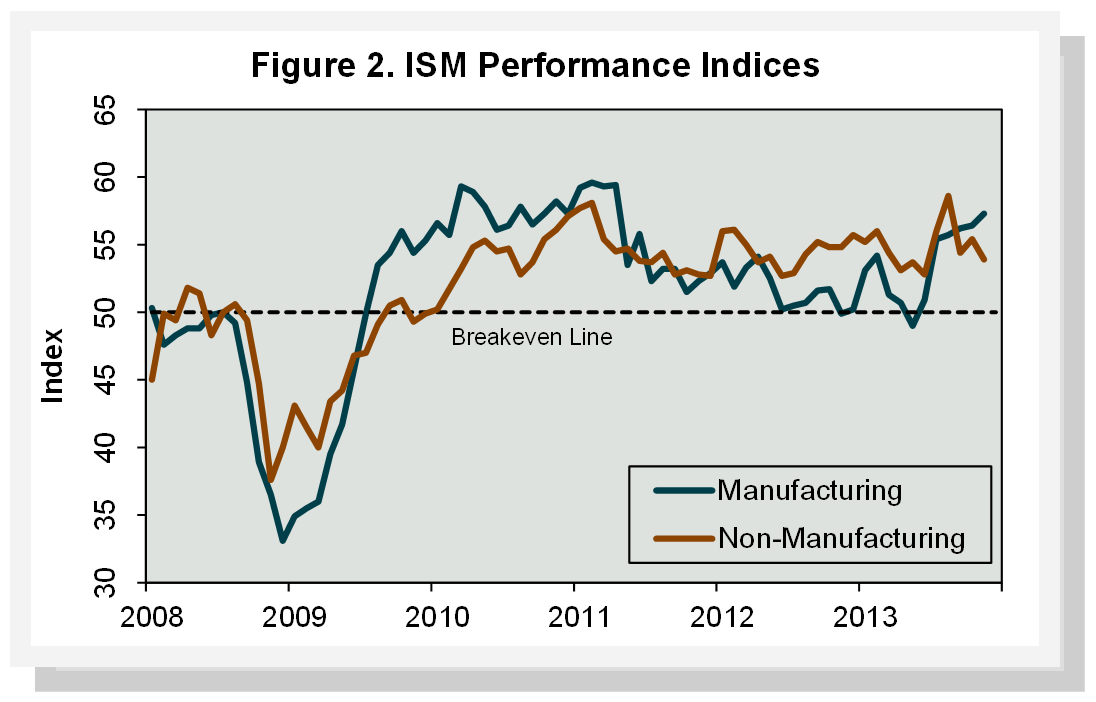
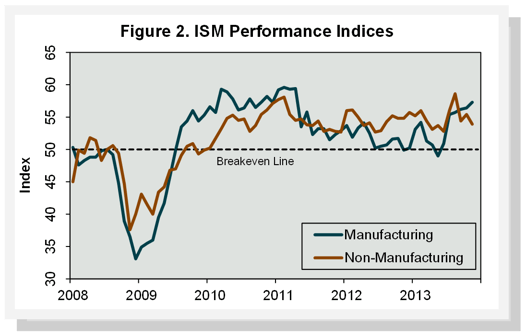
For a second month in November, more manufacturing businesses surveyed by the Institute for Supply Management (ISM) indicated that their activity expanded than any time since April 2011 (Figure 2). The PMI rose to 57.3%, an increase of 0.9 percentage point from October's reading of 56.4% (50% is the breakpoint between contraction and expansion). “With 15 of 18 manufacturing industries reporting growth in November,” said ISM’s Bradley Holcomb, “the positive growth trend characterizing the second half of 2013 is continuing.”
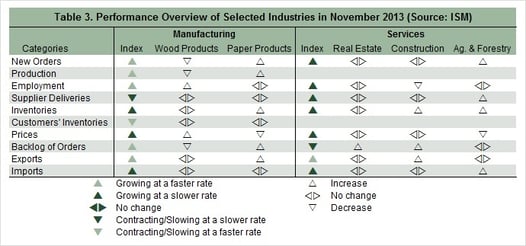
For manufacturing overall, orders, production and employment were up in November; inventories were either essentially unchanged or decreasing; and input prices rose more slowly (Table 3). Performance of the two manufacturing industries we track diverged, with Wood Products contracting but Paper Products expanding. Wood Products orders and production fell, and input prices rose. For Paper Products, orders and production rose while input prices fell.
Growth in the larger service sector slowed again in November. The NMI registered 53.9%, 1.5 percentage points lower than October’s 55.4%. Sub-indices related to new orders, business activity and employment all declined relative to October (the employment index to its lowest point since May). Nonetheless, “respondents' comments for the most part indicate the non-manufacturing sector is maintaining a steady course of incremental growth and a positive outlook for the upcoming months.” said ISM’s Anthony Nieves.
Among the individual service industries we track, only Ag & Forestry expanded (thanks to new orders, higher inventories and imports). The drop in Construction employment was enough to offset increases in inventories and backlogged and new export orders. Real Estate was unchanged.
Relevant commodities up in price included corrugated boxes. Caustic soda, gasoline, diesel and natural gas were down in price.
Interested in a forecast of these industrial performance indicators for the US? Visit the Economic Outlook section of our website to learn more.


