
4 min read
This is the first installment of a two-part series documenting land use changes and how they have affected forests in the US and US South. These posts were informed by Forest2Market’s report entitled “Historical Perspective on the Relationship between Demand and Forest Productivity in the US South,” which is available here.
Working forests play an important role in keeping forested land forested, as our previous analyses have demonstrated. Working forests store carbon, provide recreational opportunities and support the economic vitality of many rural communities. However, working forests face competing land use pressures that place them at risk of conversion to other uses.
Since 1953, US population has approximately doubled from 159.0 to 321.4 million in 2015 (Figure 1). US South population increased even more dramatically (166 percent) from 40.4 to 107.3 million people. Annually, US population increased at a rate of 1.2 percent while US South population increased 1.6 percent.
As population increased and post-WWII government policies promoted homeownership, the rate at which Americans built homes increased as well. During the Great Depression and World War II era, housing starts averaged 360,000 annually. Since 1959, between 1.0 and 2.0 million housing units were started annually except during and following the Great Recession (i.e. 2008-2013) when housing starts dipped to just over 500,000 starts, their lowest point in the last 50 years (Figure 2).
Rising populations and expanded home-building placed pressure on other land use types. The U.S. Forest Service[i] reports that between 1950 and 2002, cropland, pasture/range and forest land each declined by more than 5 percent. Urban and other land, meanwhile, increased by more than 60 percent.
Development has continued to expand in more recent years, as shown by recent National Resource Inventory[ii] data from the USDA (Figure 3). Developed land increased 59 percent from 71.9 to 114.1 million acres between 1982 and 2012. Forest land increased by about 3 million acres or 1 percent. Cropland, pastureland and rangeland decreased by 57.9, 10.2 and 13.6 million acres, respectively.
Just by looking at Figure 3, one might assume that all new development happened on crop, pasture and range lands and that very little conversion from forest occurred; after all, the amount of forest land increased during this time. However, land use change is much more nuanced: Shifts out of a land use type may be replaced by shifts into that same land use type. If more land shifted into a land use type than was converted out of that type, the conversion that occurred will not show up. Therefore, simply looking at changes in totals does not show the full picture of land use change.
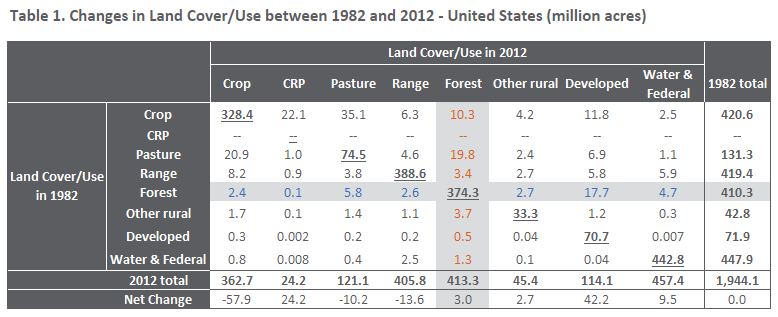
Table 1 shows a more detailed picture of land use change that occurred between 1982 and 2012 by showing the amount of land that was in each category at both time points and how land use shifted between categories using a matrix. Each row sums to the 1982 total for a specific land use type, and each column sums to the 2012 total for a specific land use type. For example, there were 410.3 million acres of forest[iii] in 1982 and 413.3 million acres in 2012. Forests (highlighted in gray) experienced a net increase of 3.0 million acres.

The cell where 1982 and 2012 land cover/uses intersect shows the amount of land that did not change from one period to the next and is shown in bold, underlined font. Each other cell shows how the land cover/use changed from 1982 to 2012 within each land cover/use type. For example, approximately 374.3 million acres were classified as forest land at both measurements; in other words, 91.2 percent of land that was forested in 1982 remained forested in 2012.
That means that a little over 36 million acres of forest (approximately 9 percent of the forest land that existed in 1982) converted to other uses, as indicated by blue font. Of the forest land that was lost, most was converted to developed[iv] land (17.7 million acres, 49.2 percent), pastureland[v] (5.8 million, 16.0 percent) or water areas or Federal land (4.7 million, 13.1 percent).
Forest land cover/use increased from 1982 to 2012 because some other land cover/use types converted to forests. Orange font indicates acres that converted to forest land in 2012 from another cover/use type in 1982. For these cells, by looking at the land cover/use associated with the row, one can determine what the land cover/use was in 1982. Most of the converted acres were previously pastureland (19.8 million acres, 50.8 percent), cropland (10.3 million, 26.4 percent) or other rural land (3.7 million, 9.5 percent). Only 1.2 percent (0.5 million) was previously developed land.
Over the past thirty years, by far the biggest threat to forests has been urbanization. Rarely does developed land become forest; rather, most new forest land comes from previously agricultural land. It was conversion from these agricultural land use types to forest that offset the loss of forest to development.
[i] https://www.treesearch.fs.fed.us/pubs/17334
[ii] https://www.nrcs.usda.gov/wps/portal/nrcs/main/national/technical/nra/nri/
[iii] As used in the NRI, forest land is: “A land cover/use category that is at least 10 percent stocked by single-stemmed woody species of any size that will be at least 4 meters (13 feet) tall at maturity. Also included is land bearing evidence of natural regeneration of tree cover (cut over forest or abandoned farmland) and not currently developed for nonforest use. Ten percent stocked, when viewed from a vertical direction, equates to an areal canopy cover of leaves and branches of 25 percent or greater. The minimum area for classification as forest land is 1 acre, and the area must be at least 100 feet wide.”
[iv] As used in the NRI, developed land is “A combination of land cover/use categories, large urban and built-up areas, small built-up areas, and rural transportation land.”
[v] As used in the NRI, pastureland is: “A land cover/use category of land managed primarily for the production of introduced forage plants for livestock grazing. … For the NRI, includes land that has a vegetative cover of grasses, legumes, and/or forbs, regardless of whether or not it is being grazed by livestock.”


