
 Suz-Anne Kinney
Housing returned to its “one step up, one step back” pattern in December. Existing home sales increased while new home sales declined. Builder confidence was up, but new residential construction was down. Mortgage interest rates fell, but so did pending home sales.
Mortgage Interest Rates
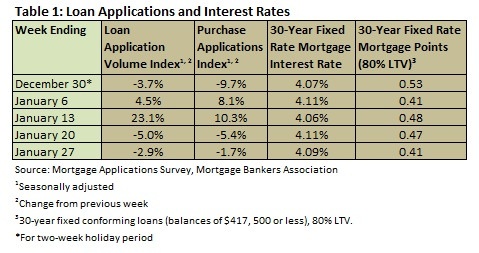
According to the Mortgage Bankers Association’s weekly mortgage application survey for the week ending January 27 (the last week that the MBA issued a report), the four-week moving average for the mortgage application index increased by 4.11 percent. The four-week moving average for the Purchase Index increased by 2.48 percent. Table 1 summarizes the weekly results of the MBA’s weekly mortgage application survey.
Mortgage interest rates remained at historic lows in December. Throughout the month, the interest rate for a 30-year fixed conforming mortgage (loan balances of $417,500 or less) remained between 4.06 and 4.11 percent, with points varying from 0.41 to 0.53. Nonconforming loans (loan balances higher than $417,500) were slightly higher and FHA loans were slightly lower.
Construction
Table 2 summarizes the Census Bureau’s November new residential construction report.
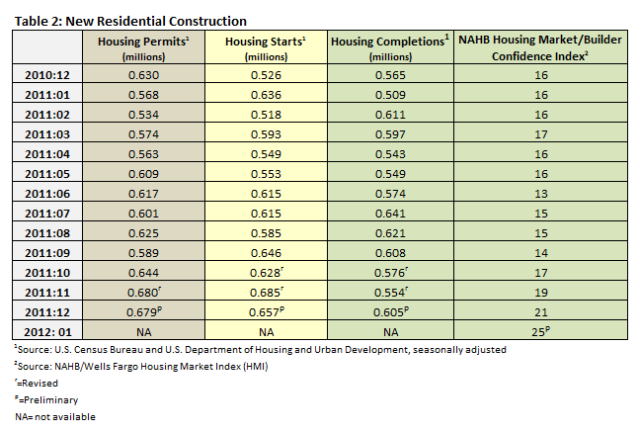
Yearly totals were reported with the December data as well: the total number of permits issued in 2011 was 611,900 (a change of 1.2 percent year over year); the total number of housing starts in 2011 was 606,900 (a change of 3.4 percent year over year); and completions in 2011 totaled 583,900 (a 10.4 percent decrease year over year).
Builder confidence continues to improve. After September’s low of 14, each month has seen a step change: October jumped to 17, November to 19, December to 21 and finally January, which saw the largest increase since the recession started, up 4 points to 25. With four straight months of gains on the boards, Bob Nielsen, chairman of the National Association of Home Builders (NAHB) said this: “Builder confidence has now risen four months in a row, with the latest uptick being universally represented across every index component and region. This good news comes on the heels of several months of gains in single-family housing starts and sales, and is yet another indication of the gradual but steady improvement that is beginning to take hold in an increasing number of housing markets nationwide -- and that has been shown by our Improving Markets Index.
The Improving Markets Index (IMI) isolates pockets of improving conditions across the nation. In December, the IMI found 76 markets that showed improvement for at least six months in three economic areas—housing permits, employment and housing prices. This is up from 41 in November. The markets, now too many to list here, can be found here.
Home Sales
Table 3 shows sales of new and existing homes in November as well as the pending home sales index.
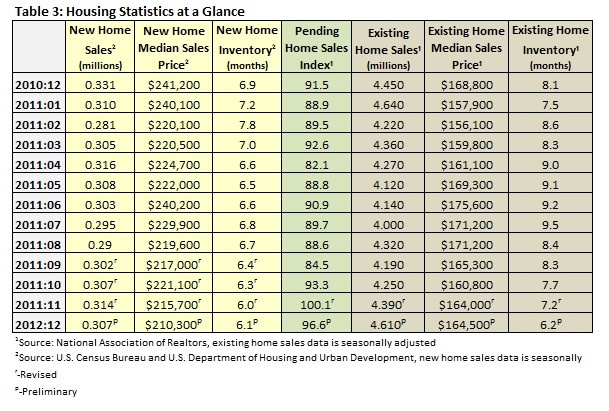
In addition to publishing the December numbers, the report also included totals for 2011. An estimated 302,000 homes were sold in 2011, down from 323,000 in 2010 (a 6.2 percent decrease).
The median sales price of new houses sold in December 2011 was $210,300; the average sales price was $266,000. The seasonally adjusted estimate of new houses for sale at the end of November was 157,000, a supply of 6.1 months at the current sales rate.
Sales of existing homes were at a seasonally adjusted annual rate of 4,610,000 in December, according to estimates released by the National Association of Realtors (NAR). This is 5.0 percent above the revised November rate of 4,250,000 and 3.6 percent above the December 2010 estimate of 4,450,000. The NAR pegs total existing home sales in 2011 at 4,260,000, a 1.7 percent increase over 2010.
The median sales price of existing homes sold in December 2011 was $164,500; this is 2.5 percent below the December 2010 price of $168,800. Months of inventory fell 13.9 percent to 6.2 months at the current sales rate; this is a 23.5 percent improvement over December 2010’s number of 8.1.
The Pending Home Sales Index, a forward-looking indicator based on contract signings, fell in December, though it remained above the December 2010 mark. The index fell 3.5 percent to 96.6 in December. This is 5.6 percent above December 2010, when it stood at 91.5.
Lawrence Yun, NAR chief economist, commented: “Even with the modest decline, the preceding two months of contract activity are the highest in the past four years outside of the homebuyer tax credit period.”
Collectively, this month’s data shows that the housing market is still making halting progress toward recovery. Other data indicates that the market should turn around sooner rather than later:
- According to the U.S. Census Bureau, the nation's homeownership rate is 66%. The most recent Housing Opportunity Index (HOI), however, indicates that a near-record 72.9 percent of all new and existing homes sold in 3Q2011 were affordable to families earning the national median income of $64,200.
- In addition, a recent NAHB survey found that homeownership is still a goal for 68 percent of all non-homeowners.


