
 Pete Stewart
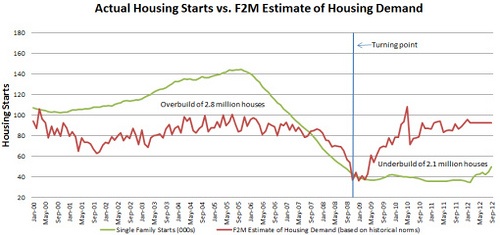
Over the past two years, we at Forest2Market have pointed out the extreme housing overbuild that occurred during the boom years and the equally extreme underbuild that followed the financial crash. As this figure shows, Forest2Market’s forecast and modeling indicates that, between January 2000 and December 2008, US homebuilders built about 2.8 million more single family homes than could be occupied. Since that time, homebuilders built about 2.1 million fewer single family homes than were needed.
Furthermore, the long-term underlying demand for housing (the red line in the figure) really didn’t change that much, if at all. According to our model, demand for new homes in the US is between 1.2-1.4 million homes per year. This demand stems from social changes and factors that are not necessarily tied to economics (after all, everyone needs a roof over their head). These factors include :
- New family formations – married couples moving into a first home, single people going out on their own
- Divorce – one party looking for a new home
- Immigration
- Demolitions
Because the underlying demand has not changed much, the amount of inventory grew from 2000 to 2008. When the financial crash came, a growing number of unemployed and underemployed people defaulted on their loans and others, caught with two or more homes, needed to divest. As a result, the inventory of unoccupied homes skyrocketed. Naturally, home prices fell.
But the good news is that economics works. As prices plunged, people were able to buy homes at basement prices, and inventories declined. Construction of new homes slowed dramatically, and inventories continued to decline.
As a result, the US has largely worked through its inventory problems. Currently, inventory of existing homes stands at just 5.4 months. Most builders believe that a healthy inventory level is between 4-6 months. So that’s good news. Even better for the outlook, we are still building considerably fewer homes per month than Forest2Market’s model would predict based on economic conditions and the long-term demand of 1.2-1.4 million homes.
So, is there only one way to go? Well, the verdict has not been rendered, but the data—finally—looks good.
To get Forest2Market's Housing Start Forecast, subscribe to our Economic Outlook.
Comments
11-30-2012
For southern timberland owners with pine sawtimber still worth almost half it’s 2008 value, this news is torture. So close, yet so far!
If new housing starts continue to grow, it will be interesting to see how this plays out at the stump over the next 2-4 years:
We have a pine sawtimber inventory that is huge and growing, a logging capacity greatly diminished over the last 5 years, mills that may soon actually need more than gate-wood to run on.
We hear some people talk about a ‘perfect storm’ in the supply chain and resulting high-price opportunities for landowners who are prepared to exploit the chain disruptions.
Thanks for your great analysis!
Tom Brickman, RF, ACF
http://www.CyprusPartners.com
Comments
Housing Market Update – October 2012 | F2M M
11-30-2012
[...] shrinking inventory and making way for additional new construction (see Pete Stewart’s Housing Market Improves). Existing home sales gained 2.1% month over month and 10.9% year over year (Table 2). Months [...]
Comments
12-03-2012
The great question will be .... What happens to exisiting real estate sales, housing starts, and timber prices when the banks unload the hidden foreclosures they have on their books?
Most landowners are still looking for a positive note so they can sell their timber and when they see it, they will unload the glut of timber Tom Brickman describes. Then we may have the perfect storm. But will it be positive or negative for timber prices??
Greg Conner, RF, ACF


