
 Suz-Anne Kinney
Housing Market Continues Recovery For the last three years, the housing market has mounted a recovery in spring only to give way to a summer slide and a series of flip-flops through the end of the year. Will this year, with its spring upswing, be different? We think so.
Outside of existing home sales, every indicator we track in this column improved in May—new home construction, builder confidence, new home sales, pending home sales, mortgage rates and home prices all point to a continuing recovery for the housing market.
New Residential Construction
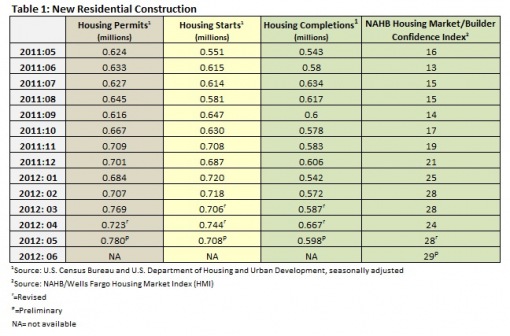
Table 1 summarizes the Census Bureau’s May new residential construction report.
In the May report, April’s housing start number was revised from 699,000 to 744,000, a 6.4 percent increase. Starts in the month of May fell 4.8 percent below this revised number to 708,000, which is 28.5 percent above the May 2011 rate of 551,000.
The Bureau also revised the number of single family housing starts for April from 492,000 units to 500,000. In May, single family starts increased 3.2 percent to 516,000.
April’s building permit number was also revised; it traveled from 715,000 to 723,000. Permits gained ground in May as well: at 780,000, they were nearly 8 percent higher than April’s revised number, and 25 percent above the May 2011 rate of 624,000.
As permits are a leading indicator of the market, new home construction appears set to remain in recovery mode.
Builder confidence continued to climb. The builder confidence index gained 1 point in May, up from a downwardly revised 28 in April (March’s number was 24). A rate above 50 indicates the market is healthy.
Home Sales
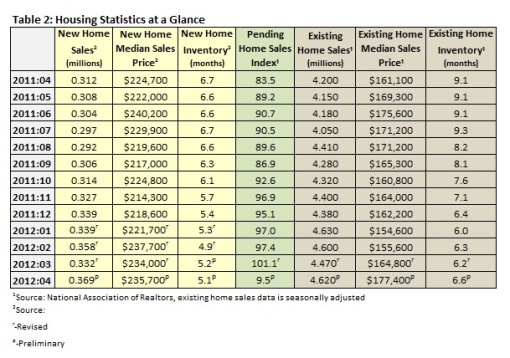
Table 2 shows sales of new and existing homes in May as well as the pending home sales index.
New Home Sales Strong
Sales of new single-family homes in May 2012 were at a seasonally adjusted annual rate of 369,000, 7.6 percent above the April rate of 343,000 and 19.8 percent above May 2011’s level, according to estimates released jointly by the U.S. Census Bureau and the Department of Housing and Urban Development. This is a two-year high and better than expected, due primarily to mortgage rates that continue to drop and the low inventory of existing homes for sale.
The seasonally adjusted estimate of new houses for sale at the end of May was 145,000, a supply of 4.7 months at the current sales rate. The record high was recorded in January 2009 at 12.1 months.
Regionally, new-home sales increased by 36.7 percent in the Northeast and 13 percent in the South. After posting strong gains in April, both the Midwest (-10.6 percent) and West (-3.5 percent) fell.
Existing Home Sales Fall, Pending Sales Strong
May sales of existing homes decreased 1.5 percent to 4,550,000, according to the National Association of Realtors (NAR). This is a 9.6 percent increase year over year. According to Lawrence Yun, the chief economist at the National Association of Realtors (NAR), this drop is most “likely due to supply constraints rather than softening demand.” Low inventory is a significant factor in both the West and Florida.
Months of inventory increased in May as a result, up to 6.6 months at the current sales rate. This is 1.5 percent above April 2012’s number, though 27.5 percent below May 2011’s 9.1 months of supply. At the end of the period, there were 2,490,000 existing homes on the market.
The Pending Home Sales Index, a forward-looking indicator based on contract signings, increased by 5.9 percent in May from 95.5 in April to 101.5, which was March’s number as well. This is a 13.3 percent increase over May 2011’s 89.2 reading.
The Cost of Buying a Home
Table 3 summarizes the weekly results of the MBA’s weekly mortgage application survey.
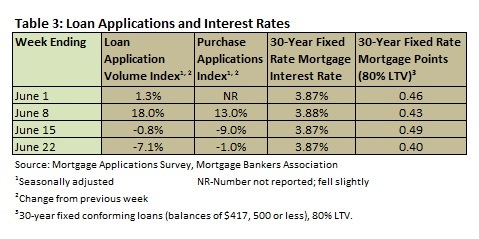
Mortgage interest rates fell in June to the lowest level since the Mortgage Bankers Association began collecting data. Throughout the month, the interest rate for a 30-year fixed conforming mortgage (loan balances of $417,500 or less) hovered at 3.87 percent, with points varying from 0.40 to 0.49.
The median sales price of new houses sold in May was $234,000 (a decrease of 0.6 percent over April 2012 and a 5.6 percent over May 2011), and the median sales price of existing homes increased from $173,700 to $182,600, an increase of 5.1 percent over April 2012 and 7.9 percent over May 2011’s level of $169,300 (Table 2).
The S&P/Case-Shiller 10- and 20-city indexes both posted a 1.3% increase in April. The previous seven months all saw declines. “With April 2012 data, we finally saw some rising home prices,” said David M. Blitzer, Chairman of the Index Committee at S&P Indices. “On a monthly basis, 19 of the 20 MSAs and both Composites rose in April over March. Detroit was the only city that saw prices fall, down 3.6%. In addition, 18 of the 20 MSAs and both Composites saw better annual rates of return. It has been a long time since we enjoyed such broad-based gains. While one month does not make a trend, particularly during seasonally strong buying months, the combination of rising positive monthly index levels and improving annual returns is a good sign. The 10-City and 20-City Composites each rose by 1.3% for the month and posted annual rates of return of -2.2% and -1.9% compared to April 2011, better than the -2.9% and -2.6% annual rates seen in March 2012.”
This combination of low interest rates and appreciating home values may convince potential home buyers that now is the time to buy.


