 Suz-Anne Kinney
What Lawrence Yun, the chief economist at the National Association of Realtors (NAR), said last month about the housing market –“We should not expect the recovery to be in a straight upward path—it will zig-zag at times”—held true in February. Results were mixed. Sales of both new and existing homes were down, as were building permits and starts. Pending home sales were up, however, as were builder confidence and new home completions.
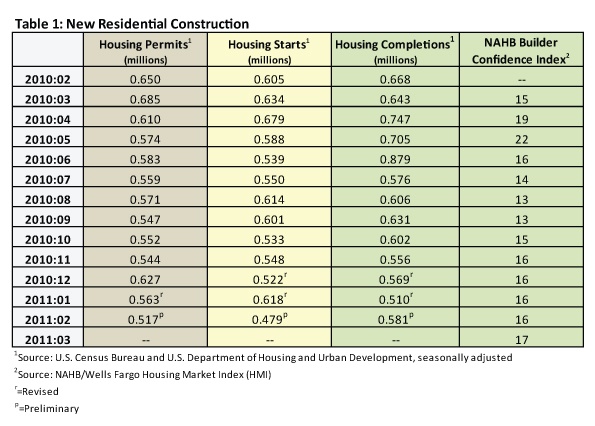
Building permits fell 8.2 percent in February, after a 10.4 percent decline in January, down to an annualized rate of 517,000 from January’s level of 563,000 (Table 1). Housing starts also fell to an annualized rate of 479,000 (down from 618,000). This is 22.5 percent below January’s level and a year-over-year decrease of 20.8 percent. Completions improved in February, up 13.9 percent to an annualized rate of 581,000. Year-over-year, the number of completions was down 13 percent, however.
After four straight months at 16, the Builder’s Confidence Index (Table 1) rose one point to 17 in March. Regionally, both the West gained 4 points and the South gained 2. The Midwest remained flat, and the Northeast lost a point. An index number above 50 indicates more builders think the market is good than poor.
Sales of new and existing homes were both down. Sales of new single family homes (Table 2), for instance, were 16.9 percent below January’s annualized rate and 28 percent below February 2010’s rate. At the current sales rate of 250,000 (annualized), 8.9 months of inventory are sitting on the market. That figure is more than 20 percent above January’s inventory level and 11 percent above February 2010. Sales of existing homes (Table 2) declined in February, down 9.6 percent to an annualized rate of 4.88 million homes. Months of inventory increased, up 14.7 percent to 8.6 months.
One factor that put downward pressure on home sales was weather. In addition, Yun had this to say about the declines: “Housing affordability conditions have been at record levels and the economy has been improving, but home sales are being constrained by the twin problems of unnecessarily tight credit, and a measurable level of contract cancellations from some appraisals not supporting prices negotiated between buyers and sellers.”
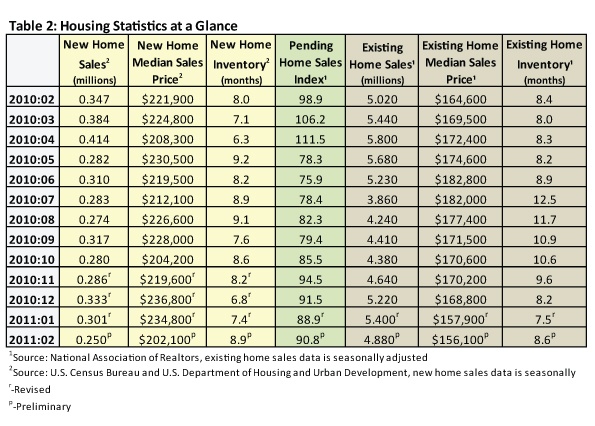
While permits and starts both fell in February, the other leading indicator, The Pending Home Sales Index (Table 2), gained 2.8 percent in February to 88.9, less than industry experts had predicted. The index is just 1.5 percent below the 90.3 level of January 2010 when the homebuyer tax credits were in place. Yun points out that it is important to look at longer term performance: “Pending home sales have trended up very nicely since bottoming out last June, even with periodic monthly declines. Contract activity is now 20 percent above the low point immediately following expiration of the home buyer tax credit.”
Home prices continue their downward trajectory. The Standard & Poor’s Case-Shiller Home Price Index shows that housing prices fell for the sixth month in a row. The Index declined by 1 percent in January. Median prices for existing homes were down 5.2 percent from January, and new home median prices fell 13.9 percent in February.
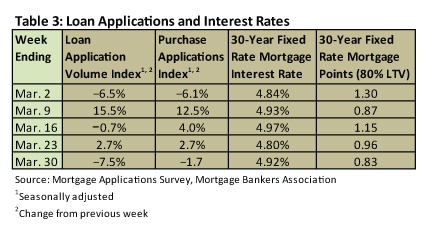
Interest rates on 30-year mortgages remained under 5 percent throughout March (Table 3). Like all other indicators, applications exhibited the zig-zag pattern.