 Suz-Anne Kinney
The majority of statistics about the housing market released in September continued to support the view, nearly universal now, that the housing market has climbed out of the ditch and is on the road to a sustainable recovery. Home prices in July and August continued to show strength.
- In the second quarter, the S&P Case-Shiller national index rose 2.2 percent quarter over quarter, the largest quarterly gain since late in 2005. In July, prices continued their ascent, climbing 1.6 percent month over month.
- The Case-Shiller report also noted that the recovery in prices is not starting to apply to the bottom third of the market. Both the mid and lower tiers are catching up with the top tier as far as improvement is concerned.
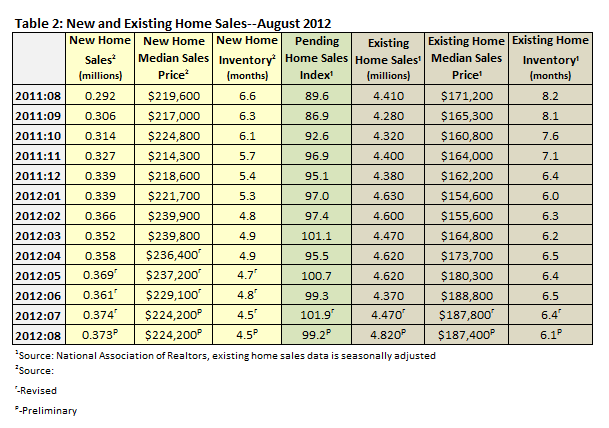
- According to the National Association of Realtors, the median price for an existing home increased to $187,400, a 9.5 percent increase from August 2011 (Table 2). This marked the sixth month in a row that prices have increased year of year; the last time this happened was between December 2005 and May 2006.
- According to the Census Bureau and the Department of Housing and Development, the median price of a new home increased by 11 percent in August ($256,900) from July’s price ($231,100). This is 17 percent higher than the median price in August 2011 ($219,000).
- Prices of distressed homes continued to increase.
Market conditions continue to support the view that this improvement will continue.
- The number of distressed properties on the market continued to decline. According to the National Association of Realtors, these properties made up 22 percent of August existing home sales, down from 24 percent in July and 31 percent in August 2011.
- Existing home inventory in August stood at 6.1 months (Table 2). This is an 18.2 percent improvement since August 2011, when supply was at 8.2 months. Sales of existing homes continued to increase. In August, they were up by 7.8 percent (9.3 percent year over year).
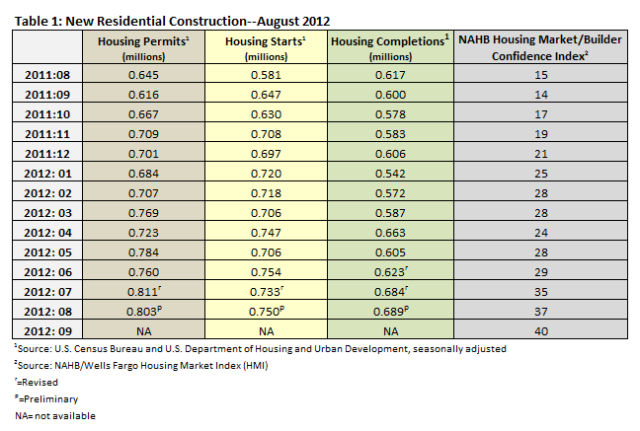
- New home inventory in July was reported at 4.5 months (Table 2). New home sales fell by just 1,000 units in August (0.3 percent), a 27.7 percent increase over August 2011. Because inventory is low and sales are better than they have been in years, the Home Builders/Wells Fargo index rose 3 points to 40, the highest level since June 2006.
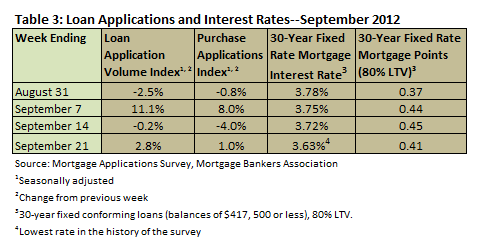
- According to the Mortgage Bankers Association, interest rates set record lows in the most recent two weeks--September 14 and 21 (Table 3).
Residential construction numbers (Table 1) show that the number of new home starts increased by 2.3 percent August over July. They are 29.1 percent higher than they were in August 2012. The number of permits issued was down just 1 percent in August, though still 24.5 percent higher than August last year.
The following tables show the details of the housing statistics in this August/September reporting period.