
 Suz-Anne Kinney
The Bureau of Economic Analysis revised its estimate of 3Q2011 GDP growth from 2.5 percent to 2.0 percent this month. Several signs suggest growth in 4Q could be equally as strong. Though many economists—including those at Forest2Market—are still forecasting another recession to arrive any moment, private sector job growth appears to have picked up. Most housing statistics also showed improvement.
Mortgage Interest Rates
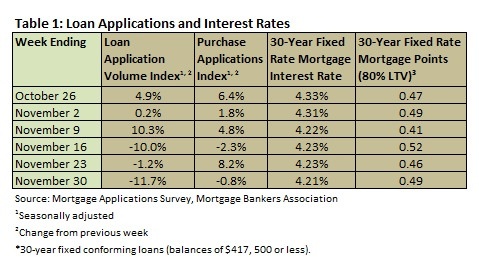
According to the Mortgage Bankers Association’s weekly mortgage application survey for November 30, the four-week moving average for the Mortgage Application Index decreased by 3.29 percent. The four-week moving average for the Purchase Index increased by 2.37 percent. Table 1 summarizes the weekly results of the MBA’s weekly mortgage application survey.
Mortgage interest rates remained at historic lows in November. Throughout the month, the interest rate for a 30-year fixed conforming mortgage (loan balances of $417,500 or less) remained between 4.21 and 4.23 percent, with points varying from 0.41 to 0.52. Nonconforming loans (loan balances higher than $417,500) were roughly a quarter of a point higher and FHA loans were roughly a quarter of a point lower.
The MBA also reported that delinquency rates improved in 3Q2011. The delinquency rate for 1-4 unit residential properties fell to 7.99 percent, the lowest level recorded since 4Q2008. The MBA’s VP of Research and Economics, Michael Fratantoni, made the following observation about the delinquency numbers: “The thirty day delinquency rate, the measure of early stage delinquency, reached its lowest level since the second quarter of 2007, a sign that new mortgage delinquencies have slowed. Foreclosure starts, however, increased this quarter, the first increase in a year after declining for three straight quarters, and is now back up to the levels of the first quarter of 2011. This is largely driven by loans leaving the loss mitigation process and the ending of state remediation programs and foreclosure moratoria.”
Construction
Table 2 summarizes the Census Bureau’s October new residential construction report. Starts fell 0.3 percent to 628,000 (after climbing 15 percent last month); they are still 16.5 percent above October 2010’s level, however. If permits are any indication, the number of starts could turnaround in the next month or two: the number of permits increased by 10.0 percent month over month to 653,000. This is 17.7 above October 2010’s level. Completions fell by 5.7 percent to 584,000; this is 2.8 percent below October 2010’s level.
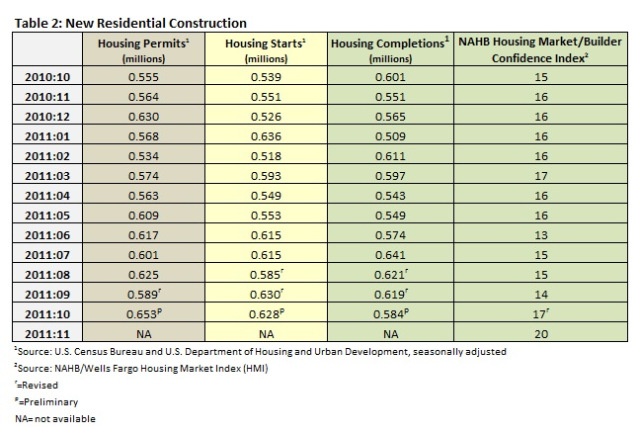
Another good sign for the housing market is builder confidence, which jumped 3 points to 20 (Table 2; note that last month’s number was revised downward to 17), according to the National Association of Home Builders (NAHB). NAHB Chairman, Bob Nielsen assessed progress in this way: “While this second solid monthly gain on the builder confidence scale is encouraging, the overall measure remains quite low due to the many challenges that home building continues to face with regard to the high number of foreclosures, the difficulties of obtaining construction financing and accurate appraisals, and the restrictive lending environment that is discouraging potential buyers. These problems must be addressed so that housing can contribute to economic and job growth the way it has in the past.”
David Crowe, the NAHB’s chief economist, was slightly more optimistic: “This second consecutive gain in [builder confidence] is evidence that well-qualified buyers in select areas are being tempted back into the market by today’s extremely favorable mortgage rates and prices. We are anticipating further, gradual gains in the builder confidence gauge heading into 2012 due to these pockets of improving conditions that are slowly spreading.”
Another NAHB indicator, the Improving Markets Index (IMI), isolates “these pockets of improving conditions” across the nation. In October, the IMI found 23 markets that showed improvement for at least six months in three economic areas—housing permits, employment and housing prices. In November, that number increased to 30. These markets include Alexandria, LA; Amarillo, TX; Anchorage, AK; Bismarck, ND; Casper, WY; Cheyenne, WY; Corpus Christi, TX; Davenport, IA; Fairbanks, AK; Fayetteville, NC; Fort Collins, CO; Hinesville, GA; Houma, LA; Jonesboro, AR; Kankakee, IL; Lima, OH; McAllen, TX; Midland, TX; Monroe, LA; New Orleans, LA; Odessa, TX; Pine Bluff, AR; Pittsburgh, PA; Sherman, TX; Sumter, SC; Tyler, TX; Waco, TX; Waterloo, IA; Williamsport, PA and Winston-Salem, NC.
The report noted that energy and agriculture continue to be the two primary economic drivers in these markets.
Home Sales
As for sales of new and existing homes in October (Table 3), new home sales were slightly higher, 1.3 percent above September’s level and 8.9 percent above October 2010’s number. Sales of existing homes improved by 1.4 percent month over month, a 13.5 percent increase year over year. The pending home sales index jumped from 84.5 to 93.3 in October, a 10 percent improvement. This is above the October 2010 mark by 9.2 percent.
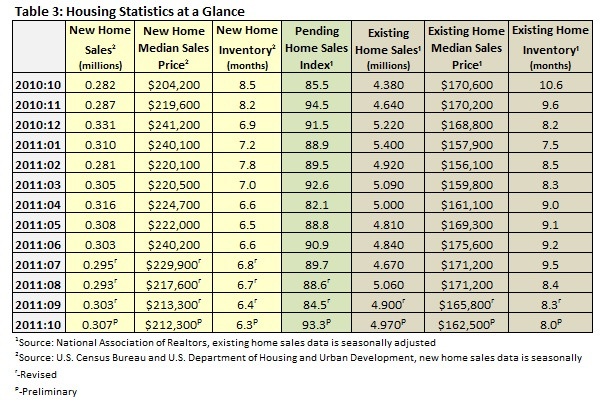
At the end of October, inventory of new homes stood at 6.3 months (an improvement of nearly 26 percent year over year). Existing home inventories stood at 8.0 months, down 3.6 percent from a revised 8.3 months last month. This is a year-over-year improvement of 24.5 percent. Lower housing inventories of both new and existing homes are positive signs that supply has been adjusted downward to meet lower demand. This could result in higher home prices in the not too distant future.
For now, however, housing prices continue to fall. Existing home prices fell 4.7 percent in October to $162,500. New home prices fell 0.5 percent to $212,300.
Comments
12-06-2011
I just got the following email from Forest2Market’s new lumber practice manager, Bob Bratton.
“Some of the areas with the largest growth are located in and around major military installations. For the past 2 years, there have been extensive improvements in base housing. I know for a fact this is occuring in Goldsboro @ Seymore Johnston Air Base, and Fayetteville @ Fort Bragg, NC. Improvements have been financed with stimulus money and are not part of the general housing market. I wonder how many military bases are in on near the areas with the highest growth? Base housing does require building permits, but the houses are not available to the general population and therefore not really part of the market. I have a friend in the real estate business in Fayettville, NC who told me the only homes being built there are on the base at Pope Air Base and Ft. Bragg. They are in the lower percentile price ranges, though, which would naturally drive the average single family house price down if they are included in the totals.”
Interesting. If any of you reside in one of the Improving Areas as identified by the NAHB, let our readers know about what you are seeing in the housing market.
Thanks, Bob.


