
 Suz-Anne Kinney
The Bureau of Economic Analysis revised its estimate of 3Q2011 GDP growth from 2.0 percent to 1.8 percent in December. Though many economists—including those at Forest2Market—are still forecasting another recession, private sector job growth appears to have picked up. It should be noted, however, that the unemployment rate is a lagging indicator, meaning that the number is unlikely to show significant improvement until the economy recovers to a healthy level. Housing statistics—especially starts and permits—are leading indicators for an improving economy. Housing statistics continued to show improvement in November.
Mortgage Interest Rates
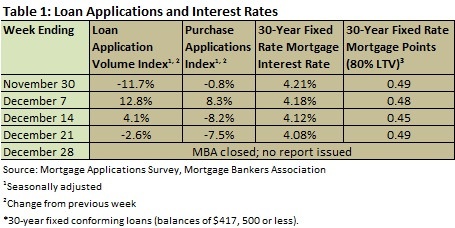
According to the Mortgage Bankers Association’s weekly mortgage application survey for December 21 (the last week that the MBA issued a report), the four-week moving average for the mortgage application index increased by 0.26 percent. The four-week moving average for the Purchase Index decreased by 1.53 percent. As this report covers the period leading up to and including the Thanksgiving and pre-Christmas holidays, a declining purchase index is not surprising. Table 1 summarizes the weekly results of the MBA’s weekly mortgage application survey.
Mortgage interest rates remained at historic lows in December. Throughout the month, the interest rate for a 30-year fixed conforming mortgage (loan balances of $417,500 or less) remained between 4.08 and 4.21 percent, with points varying from 0.45 to 0.49. Nonconforming loans (loan balances higher than $417,500) were roughly a third of a point higher and FHA loans were a fifth of a point lower.
Construction
Table 2 summarizes the Census Bureau’s November new residential construction report.
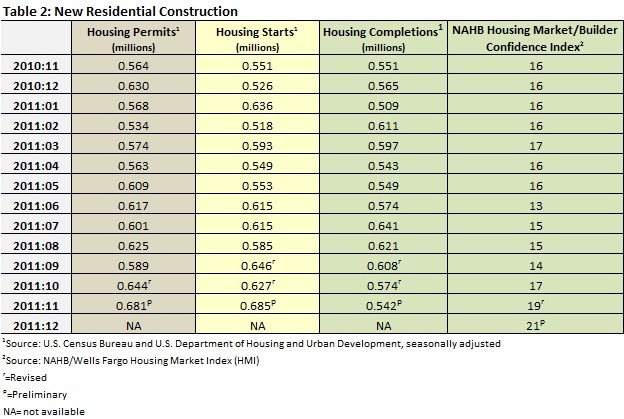
Following October’s jump in permits, new residential starts in November were at a seasonally adjusted annual rate of 685,000. This is 9.3 percent above the revised October estimate of 627,000 and 24.3 percent above the November 2010 rate of 551,000.
If permits are any indication, the number of starts will continue on an upward trajectory: November’s numbers were 5.7 percent above the revised October rate of 644,000 and 20.7 percent above the November 2010 estimate of 564,000.
Another good sign for the housing market is builder confidence. While last month’s number was revised down by 1 point, the November number jumped to 21. This represents three straight months of gains, and the highest level since May of 2010.According to National Association of Home Builders (NAHB) Chief Economist David Crowe, “This is the first time that builder confidence has improved for three consecutive months since mid-2009, which signifies a legitimate though slowly emerging upward trend. While large inventories of foreclosed properties continue to plague the most distressed markets and consumer worries about job security and the challenges of selling an existing home remain significant factors, builders are reporting more inquiries and more interest among potential buyers than they have seen in previous months.”
Another NAHB indicator, the Improving Markets Index (IMI), isolates pockets of improving conditions across the nation. In November, the IMI found 41 markets that showed improvement for at least six months in three economic areas—housing permits, employment and housing prices. The markets, now too many to list here, can be found here.
Home Sales
Table 3 shows sales of new and existing homes in November as well as the pending home sales index.
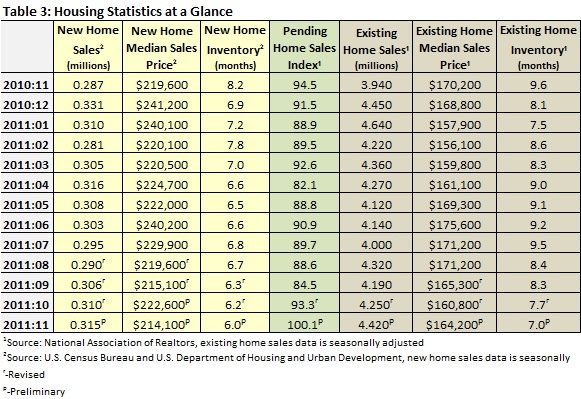
Sales of new single-family houses in November 2011 were at a seasonally adjusted annual rate of 315,000, according to estimates released jointly by the U.S. Census Bureau and the Department of Housing and Urban Development. This is 1.6 percent above the revised October rate of 310,000 and 9.8 percent above the November 2010 estimate of 287,000.
The median sales price of new houses sold in November 2011 was $214,100; the average sales price was $242,900. The seasonally adjusted estimate of new houses for sale at the end of November was 158,000, a supply of 6.0 months at the current sales rate.
Sales of existing homes were at a seasonally adjusted annual rate of 4,420,000, according to estimates released by the National Association of Realtors (NAR). This is 4.0 percent above the revised October rate of 4,250,000 and 12.2 percent above the November 2010 estimate of 3,940,000. Note that existing home sales statistics have been rebenchmarked by the NAR and revised downward in order to account for some double counting and changes in the market that have occurred during the recession.
The median sales price of existing homes sold in November 2011 was $164,200; this is 3.5 percent below the November 2010 price of $170,200. Months of inventory fell 9.1 percent to 7.0 months at the current sales rate; this is a 27.1 percent improvement over November 2010’s number of 9.6.
The Pending Home Sales Index, a forward-looking indicator based on contract signings, increased 7.3 percent to 100.1 in November from an upwardly revised 93.3 in October. This is 5.9 percent above November 2010 when it stood at 94.5. The October upward revision resulted in a 10.4 percent monthly gain.
According to the NAR, the last time the index was higher was in April 2010 when it reached 111.5 as buyers rushed to beat the deadline for the home buyer tax credit. Lawrence Yun, NAR chief economist, commented: “November is doing reasonably well in comparison with the past year. The sustained rise in contract activity suggests that closed existing-home sales, which are the important final economic impact figures, should continue to improve in the months ahead.”
The increase in the pending home sales index, the number of new residential construction permits, growing builder confidence and the declining inventory of both new and existing homes all bode well for the housing market and—since these are leading indicators—for the US economy.


