There is no polite word to describe activity during the early part of the spring buying season except abysmal. Industry performance in February was one of the worst on record. Just as winter finally loosened its grip on much of the county, which spurred slightly better activity in March, a record number of tornadoes tore through the Midwest and South, causing slowdowns. Many industry experts are concerned. According to David Crowe, Chief Economist at the National Association of Home Builders (NAHB), “persistent concerns about home values as more foreclosures are hitting the market, increasing restrictive lending requirements for home buyers and builders, and the slow pace of economic recovery” indicate more bad news is on the horizon. Housing market performance was one of the drivers of a weak GDP report for the first quarter, which showed the US economy grew just 1.8 percent.
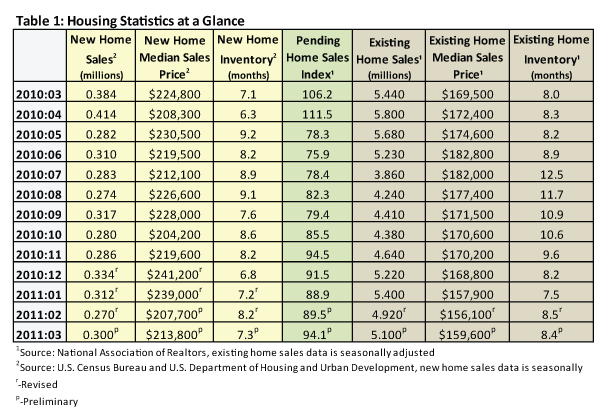
New and existing home sales and the pending home sales index all improved in March (Table 1).

New home sales gained 11.1 percent month over month (though they are still 21.9 percent below March 2010’s level). Inventory stands at 7.3 months. Existing home sales improved by 3.7 percent (down 6.3 percent year over year). The National Association of Realtors (NAR) reported an increase of 5.1 percent in its Pending Home Sales Index.
Despite an uptick in sales, home prices continued to depreciate. The Case-Shiller home price index landed just shy of its April 2009 low. The index fell by 3.3 percent year over year in February, indicating that we are already in the second leg of a double dip in home prices.
Despite an overall decline, homes at both the bottom and the top of the price range are seeing improvements. Why? Because cash is king in this market. Homes worth less than $100,000 are being gobbled up by investors paying cash. These investors then either rent the properties or upgrade the homes to sell later when the market recovers. On the other end of the spectrum, wealthy buyers, in part because of the strong performance of the stock market, can afford the large down payments lenders are requiring. A Thomson Reuters’ article by Nick Carey cites an example, for instance, of a homebuyer with good credit being unable to secure a mortgage in time. That buyer wired $2 million in cash to complete the transaction instead. (This is a clear example of how badly credit markets are currently working.)
According to the National Association of Realtors (NAR), these all-cash sales made up 35 percent of all sales in March, a record. It’s interesting to note that these two ends of the spectrum have seen price appreciation since this time last year, with the low end gaining 10 percent and the high end gaining 5 percent over the course of the last year.
Homeowners in the middle—those whose homes are worth $100,000 to $500,000—are bearing the brunt of the downward movement in prices. Homes in this price range make up 60 percent of the market, and over the course of the last year, these homes lost 14 percent of their value.
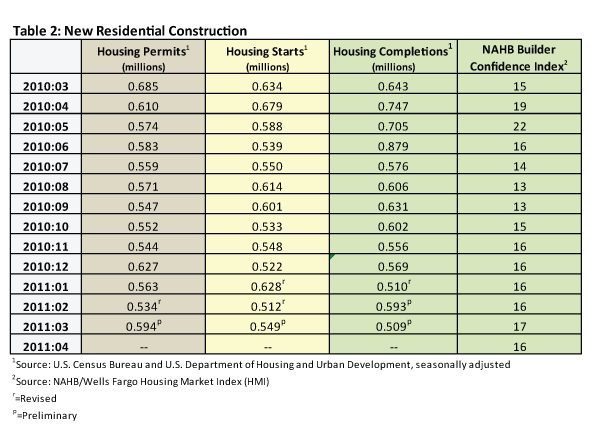
Residential construction statistics improved in March as well.
Permits were up 11.2 percent to an adjusted annual rate of 594,000 (13.3 percent below the March 2010 number). Starts improved as well, gaining 7.2 percent (still, down 13.4 percent year over year). Builder confidence slipped by 1 point (Table 2).

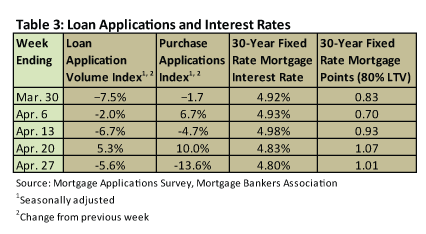
Mortgage rates remained below 5.0 percent in April (Table 3).


 Suz-Anne Kinney


