
 Suz-Anne Kinney
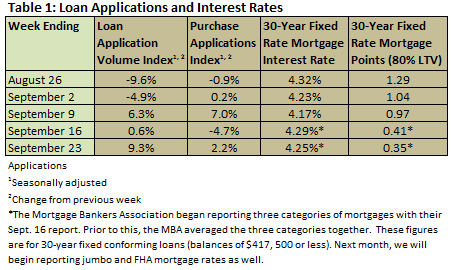
Mortgage interest rates moved even lower in September. According to the Mortgage Bankers Association’s weekly mortgage application survey, mortgage application volume increased by 9.3 percent during the week ending September 23, an increase prompted in part by lower interest rates. According to Mike Fratontoni, the MBA’s VP of Research and Economics, “Mortgage rates declined last week, at least partially in response to the Fed’s announcement that they would shift their portfolio towards longer-term Treasury securities, and that they would resume buying mortgage-backed securities.”
Table 1 summarizes the results of the MBA’s weekly mortgage application survey. It should be noted that in the week ending September 16, the MBA replaced the average 30-year fixed interest rate figure they have reported historically with interest rates for three types of 30-year fixed loans: conventional ($417,500 or less), jumbo (over $417,500) and FHA-backed. As a result, interest rates and points in the weeks ending September 16 and September 23 should not be compared with earlier weeks to determine trends.
Table 2 summarizes the Census Bureau’s August new residential construction report. Starts fell 5 percent month over month and 5.8 percent year over year. Permits were higher—3.2 percent month over month; this is 7.8 percent higher than August 2010 levels. Completions fell by 2.7 percent (2.6 percent above August 2010’s level). Completions of single-family homes came in at 477,000 on an annualized basis suggesting continued imbalance, as sales of new homes totaled just 295,000 on an annualized basis (Table 3).
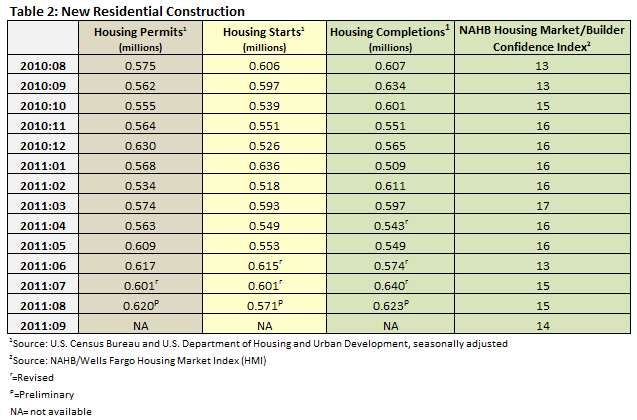
Builder confidence fell to 14 after two months at 15 (Table 2), according to the National Association of Home Builders (NAHB). “Very little has changed in terms of housing market conditions so far this year,” said NAHB Chairman Bob Nielsen. “Builders continue to confront the same challenges in accessing construction credit, obtaining accurate appraisal values for new homes, and competing against foreclosed properties that they have seen for some time.”
A consensus seems to be emerging that recovery in the housing market will take roughly five years. While this may be true in many places in the country, a new economic indicator compiled by the NAHB, the Improving Markets Index (IMI), shows that there are pockets of growth have begun to sprout up across the nation. In September, the IMI found 12 markets that have showed improvement for at least six months in three economic areas—housing permits, employment and housing prices. These markets include Alexandria, LA; Anchorage, AK; Bangor, ME; Bismarck, ND; Casper, WY; Fairbanks, AK; Fayetteville, NC; Houma, LA; Midland, TX; New Orleans, LA; Pittsburgh, PA; and Waco, TX. According to NAHB Chief Economist David Crowe, “Last year at this time, there was not a single market that showed improvement using these criteria. It’s not surprising that many of the states represented are energy rich areas. Those are the regions still experiencing relatively strong employment, supporting housing demand.”
As for sales of new and existing homes in August (Table 3), new home sales fell 2.3 percent month over month; this level is 6.1 percent above August 2010’s number. Sales of existing homes increased by 7.7 percent, 18.6 percent higher year over year. The pending home sales index fell by 1.2 percent; this is above the August 2010 mark by 7.7 percent.
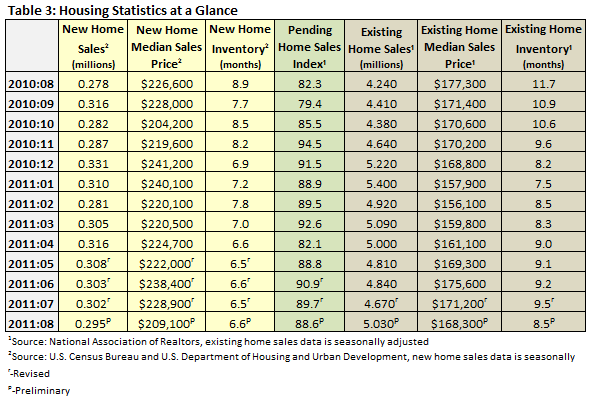
In August, inventory of new homes stood at 6.6 months, while the inventory of existing homes stood at 8.5 months. A recent chart of the day published in The Atlantic describes just how heavy the inventory overhang has become. The following chart aggregates new home inventory, existing home inventory (both shown in Table 3) and shadow inventory (a measure taken by CoreLogic on a quarterly basis to determine the number of delinquent or foreclosed homes that have yet to hit the market).
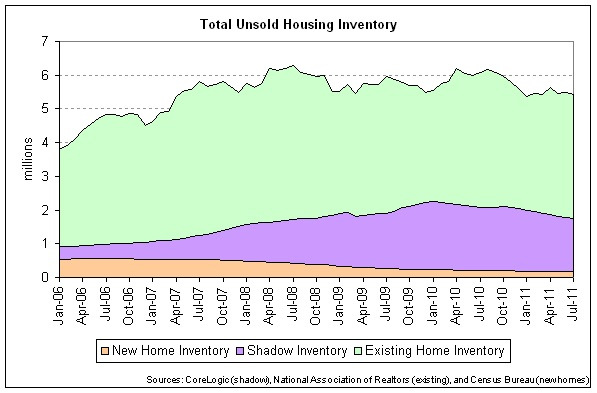
Through July, the total of these three types of inventory stood at 5.4 million homes. While this year's number has been lower than it was in 2010 (5.9 million), working through this inventory will still take a considerable amount of time. As David Indiviglio writes in the article, “Combining new and existing home sales for July, this level of inventory amounts to about 13 months of supply. In other words, if no other homes went on the market for 13 months and home buying remained constant at its July level, that’s how long it would take to sell all of the current supply. Of course, additional homes will come to market over this period of time, which explains why supply has so much trouble declining. At the start of 2006, as the housing bubble was still inflating, total inventory was just 3.8 million.” (Read the full article.)
Comments
03-13-2012
Great insight, but the answer is to get America back to work and the overage in housing will fix itself.


