
 Suz-Anne Kinney
Despite historically low-interest rates and home prices, home sales fell off the cliff in July, further hobbling a market that was already dangerously close to long-term lows.
The Mortgage Market
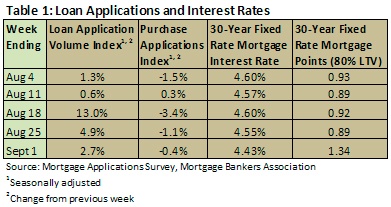
Mortgage interest rates remain at 50-year lows (Table 1). Despite this, individuals are still having trouble qualifying for loans, and these low rates are available only to the most qualified (credit scores in the high 700s or above). During August, several news organizations reported a number of horror stories about the new reasons people were being denied loans and extra obstacles that prospective buyers face.
Several reports indicate that banks are denying couples loans if the woman works and is pregnant. A report last week recounted the story of a couple (with credit scores in the high 700s and a 60 percent down payment) who were required to write an essay, similar to ones perspective students write for college applications, detailing why they were committed to their new home and whether they planned an increase or decrease in their family size (a direct violation of the Fair Housing Act, one which HUD is currently investigating). As a growing family is one of the top reasons people buy new, larger homes, this trend will certainly not help the housing market.
Still, loan applications increased during the month of August, which could mean more sales down the road.
In his analysis of the Mortgage Bankers Association’s National Delinquency Survey, MBA chief economist, Jay Brinkmann details the good news/bad news embedded in the report:
“These latest delinquency numbers contain a mixture of somewhat good news and somewhat bad news. The good news is that foreclosure starts are down and the inventory of homes anywhere in the process of foreclosure fell for the first time since 2006 and had the largest drop since 2005. Loans 90 days or more past due, the largest share of delinquent loans, also fell. The fact that both the 90+ delinquency rate fell and the foreclosure start rate fell means that a significant number of these seriously delinquent loans have been successfully modified and reclassified as performing, current loans.
“The disappointing news is that, after declining since the beginning of 2009, the rate of short-term delinquencies is going up and the increase in these short-term delinquencies may ultimately drive the foreclosure measures back up. The percent of loans one payment behind had peaked in the first quarter of 2009 at 3.77 percent and fell to 3.31 percent by the end of 2009. Unfortunately that rate has now risen to 3.51 percent. The causes are likely two-fold. First, 30-day delinquencies are very closely tied to first-time claims for unemployment insurance. The number of first-time claims fell through most of 2009 but leveled off in 2010 and have started to rise again. This increase in unemployment directly impacts mortgage delinquencies. Second, some percentage of the loans modified over the last several years have become delinquent again because those borrowers, by definition, have weak credit.”
The federal government recently announced that it will soon unveil an FHA-backed refinancing program for homeowners who owe more money on their homes than they are worth. Secretary of Housing and Urban Development, Shaun Donovan also said HUD will launch an emergency loan program to help people who are unemployed keep their homes. These programs, if successful, could help reduce the number of delinquencies and improve stability in the market.
Home Prices and Affordability
Home prices are showing signs of stabilization, though many believe this is just a consolidation of the market before it starts another drop. June over May, the S&P Case-Shiller home-price index 20-city composite increased by 1 percent. The year-over-year increase was 4.2 percent. Quarter-over-quarter, prices rose 4.8 percent, due primarily to the tax credits available for buyers.
Despite increases in median home prices and relatively flat total income figures (two of the variables that the National Association of Realtors uses to produce the Housing Affordability Index), housing is now extremely affordable. In fact, The average index in 2007 was 115.4; in 2008, 137.8; in 2009, 171.6. July’s index came in at 161.8. The year-to-date average is 168.8. (Note: the higher the number, the more affordable housing is.)
Existing, New and Pending Home Sales
In May, the Pending Home Sales Index produced by the National Association of Realtors dropped by more than 30 percent, from 110.9 in April to 77.7 in May. This leading indicator was proven accurate in July, as existing home sales fell 27.2 percent month over month (down 25.5 percent year over year), and new home sales fell 12.4 percent month over month (down 32.4 percent year over year).
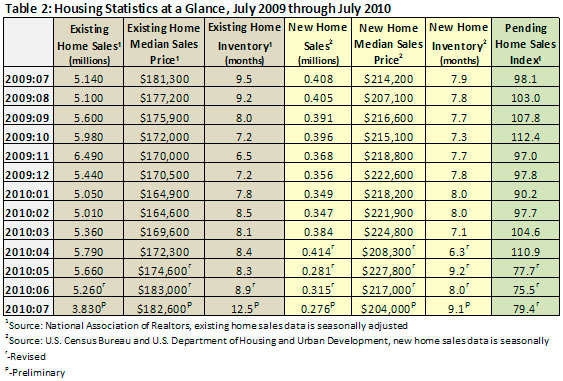
Pending home sales in June fell only slightly, however, and July’s index beat expectations by climbing 5.2 percent.
New Home Construction
New home construction statistics continue to disappoint. The number of starts did increase slightly, by 1.7 percent in July, to 546,000 units. This increase was only possible, however, because June’s number was revised downward from 549,000 to 537,000 starts. The total number of permits in July was 565,000, down 3.1 percent from June’s level and 3.7 percent lower than they were in July 2009. New residential completions dropped by 32.8 percent in July, down from 874,000 to 587,000.
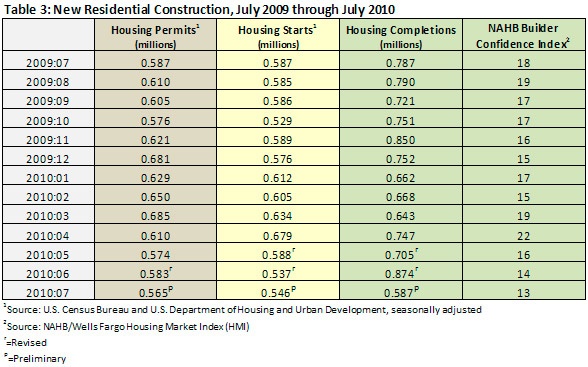
The National Association of Home Builders (NAHB)/Wells Fargo Housing Market Index (HMI) in July indicates that builders’ confidence in the market continues to be weak. The Confidence Index fell just 1 point to 13. That isn’t quite as bad as the 8s and 9s we saw in the last part of 2008 and the first part of 2009.
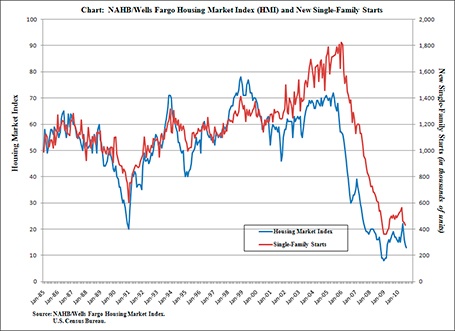
The following chart, produced by the NAHB, shows the correlation between the HMI and single family housing starts, which indicates that we are likely to see continued weakness in the new home market.
Employment is Key
In his analysis of the Mortgage Bankers Association’s National Delinquency Survey, MBA chief economist, Jay Brinkmann puts his finger on the key to a housing turnaround:
“Ultimately the housing story, whether it is delinquencies, homes sales or housing starts, is an employment story. Only when we see a consistent increase in employment will we see an increase in sales and starts, and a sustained improvement in the delinquency numbers. Until we see the increase in the number of households that comes with an increase in the number of paychecks, all measures of the health of the housing industry will continue to be weak.”
Unfortunately, August's employment figures showed that the economy lost another 54,000, mostly because 10,000 state and local government jobs and more than 100,000 census jobs (most of them temporary to begin with)were lost. Private employers added 67,000 jobs during August, far short of the number needed to begin wearing away at the 9.6 percent employment rate.


