
 Suz-Anne Kinney
June’s new residential construction statistics showed signs of weakening. Permits were off 7.5 percent, down from 985,000 to 911,000, and starts were off 9.9 percent, down from 928,000 to 836,000. Looking behind the numbers, however, the news is not nearly as bad as it appears on the surface. Single family permits actually increased in June, up from 620,000 to 624,000 (a 0.6 percent increase). The drop in permits came entirely in multifamily structures, a market known for its volatility; in this segment, permits fell 22.8 percent from 365,000 to 287,000. The news is similar for starts. Single family starts fell just 0.8 percent from 596,000 to 591,000, and the bulk of the drop occurred in multifamily structures, which were down 26.7 percent from 322,000 to 236,000.
While the market softened in June, it is clear that a housing recovery is underway. Housing starts are 10.4 percent higher than they were this time last year. In the first half of 2013, starts averaged 914,000 (annualized), a 25 percent increase over the first half of 2012. Home prices in the first quarter of 2013 were 10.2 percent higher than they were in first quarter 2012. New home sales in June were 38 percent higher than they were in June 2012 and 8.3 percent higher than they were in June of 2013.
Still, the volatility in housing construction and sales data that we’ve seen over the last six months has many analysts questioning whether the housing recovery we are experiencing is sustainable. We believe it is.
Surpassing Historical Housing Troughs
Earlier this year, James Marple—senior economist at TD Economics—looked at housing cycles since 1959. Marple determined that during the six housing cycles that occurred in this timeframe, the market highs averaged 2.1 million starts (SAAR) while the market lows averaged 858,000. Year to date, housing starts have averaged 915,000, just 6.6 percent higher than the historical market trough. According to Marple, “the most recent trough of 478,000, reached in April 2009, is the clear outlier in this series. . . . The current level of starts has only just surpassed the trough and it is still below troughs reached in 1960 and 1970. With the perspective of history, the current level of housing construction remains low.” (Read Marple’s analysis here: http://www.td.com/document/PDF/economics/special/IsTheAmericanHousingReboundSustainable.pdf)
Clearing the Pre-Recession Oversupply
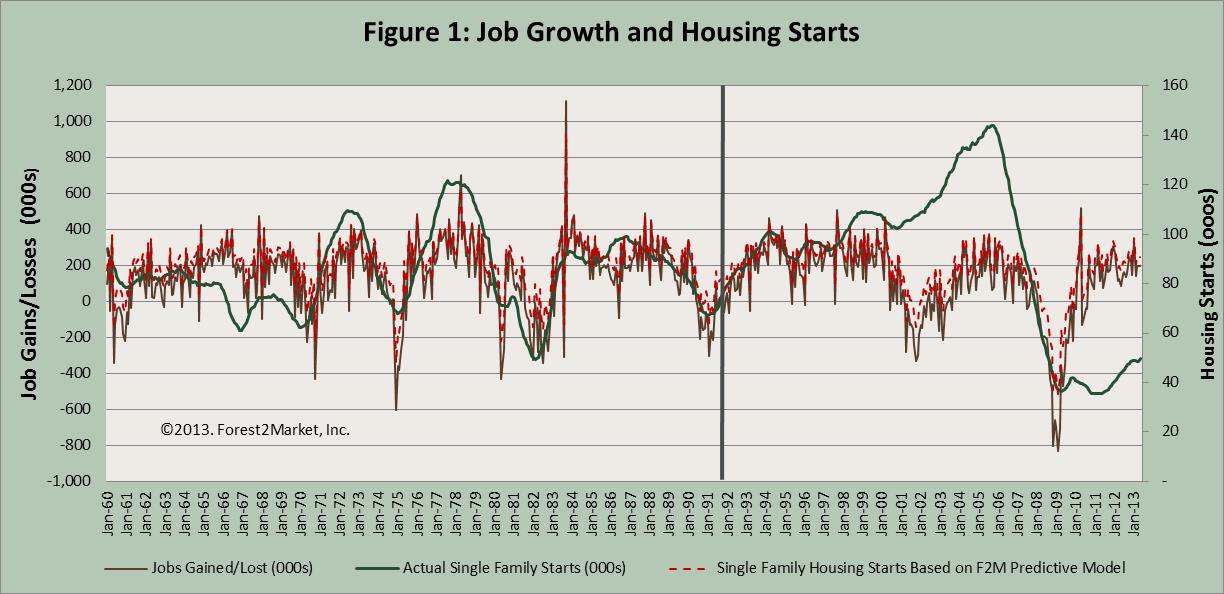
This most recent trough has been instrumental in helping clear the oversupply of housing units that built up prior to the recession. Back in 2009, Forest2Market CEO Pete Stewart developed a forecast model for housing starts based on the pre-1998 correlation between job gains (or losses) and housing starts. From 1971 through 1997, the two trends tracked pretty closely (see Figure 1). The model (the dotted red line) assumes that the historical correlation between jobs and starts remains consistent.
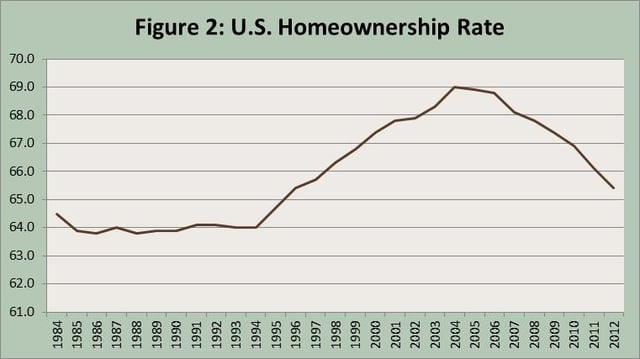
After 1998, however, the relationship between the brown line (jobs) and green line (starts) begins to break down, a result of economic expansion and housing policies that encourage higher than historical levels of home ownership. Figure 2 shows the increase in home ownership rates from a historical norm around 64 percent to a peak of 69 percent in the height of the housing bubble. The rate has yet to return to its historical average.
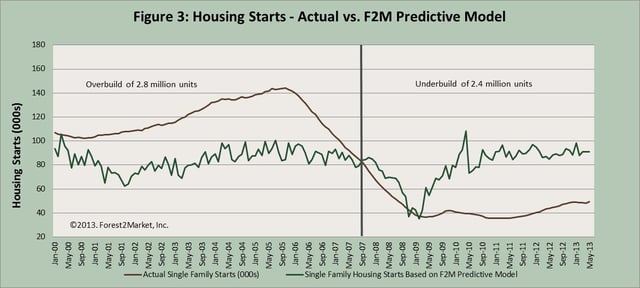
Figure 3 shows actual single family housing starts compared to the model so that the pre-recession overbuild and the recession and post-recession underbuild of housing units can be measured.
As Figure 3 makes clear, the market was oversupplied by 2.8 million housing units in the period between 2000 and September 2007. With the exception of two months since late 2007, the industry has been attempting to work away the oversupply by underbuilding significantly.
Inventory Continues to Shrink
Current inventory levels and rising home prices indicate that the oversupply is evaporating. Inventory of existing homes was 5.2 months in June, a 19 percent improvement year over year. New home inventory fell 7 percent in June, down 19 percent from June 2012, to 3.9 months. Most analysts believe that 4-6 months of inventory indicates a healthy housing market.
Demographics
With inventory low, demographic trends may be the most important ingredient to the sustainability of the housing recovery. During the Great Recession, household formation rates plummeted. We have long argued (first in 2009 and most recently here) that the long-term demand for new homes falls between 1.2 and 1.4 million homes per year (see Figure 1).
The average household formation rate between 1997 and 2007 was 1.5 million homes. This rate supported a population growth rate of roughly 2.9 million per year. During the recession, however, this household formation rate fell to 500,000 annually, supported by a growth in population of 2.7 million. By the end of the recession, the Fed estimated we had a housing shortfall of 2.6 million households. In both 2011 and 2012, new household formations recovered to the 1 million mark, though this still fell below the historical average. Going forward, to support the formation of new households, a housing start number that falls in the 1.2-1.4 million range is sustainable. Currently, annualized housing starts are 30 percent below that number, leaving sufficient room for growth.
(Note: All housing start numbers are monthly activity, annualized.)


