
 Suz-Anne Kinney
Mortgage Interest Rates
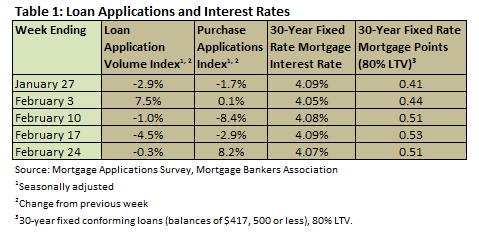
According to the Mortgage Bankers Association’s weekly mortgage application survey for the week ending February 24, the four-week moving average for the mortgage application index increased by 0.33 percent. The four-week moving average for the Purchase Index fell 0.96 percent (Table 1).
Mortgage interest rates remained at historic lows in February. Throughout the month, the interest rate for a 30-year fixed conforming mortgage (loan balances of $417,500 or less) remained between 4.05 and 4.09 percent, with points varying from 0.41 to 0.53. Nonconforming loans (loan balances higher than $417,500) were a quarter of a point higher and FHA loans were just under a quarter of a point lower.
Construction
Table 2 summarizes the Census Bureau’s January new residential construction report.
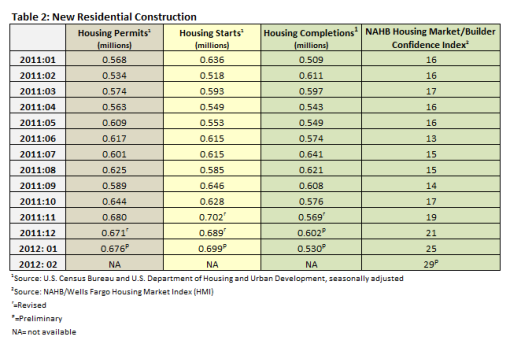
Housing starts in January came in at an annualized rate of 699,000. That’s an increase of 1.5 percent from December. It is important to acknowledge, however, that the small increase was caused by the upward revisions of November and December 2011 numbers: November increased from 685,000 to 702,000 and December increased from 679,000 to 689,000. Yearly totals for 2011 were also revised: the total number of permits issued in 2011 was 610,700 (a change of 1.0 percent year over year); the total number of housing starts in 2011 was 609,200 (a change of 3.8 percent year over year); and completions in 2011 totaled 585,200 (a 10.2 percent decrease year over year).
Builder confidence improved in February as well. After September’s low of 14, each month has seen a step change: October jumped to 17, November to 19, December to 21, January to 25 and February to 29, the highest number recorded in more than 4 years. With five straight months of gains on the boards, the National Association of Home Builders' official release included the following analysis of the market:
“Builder confidence has doubled since September as measured by the HMI,” said NAHB Chairman Barry Rutenberg, a home builder from Gainesville, Fla. “Given the recent improvements in new home starts and the increasing number of markets included in the NAHB/First American Improving Markets Index, this consistency suggests that the housing market is moving toward more sustainable growth.”
Rutenberg cautioned that the housing sector remains very fragile with significant differences between individual markets, and said policymakers must guard against actions that could impede or even reverse the gains of recent months.
“This is the longest period of sustained improvement we have seen in the HMI since 2007, which is encouraging,” said NAHB Chief Economist David Crowe. “However, it is important to remember that the HMI is still very low [any number over 50 indicates more builders see conditions as good rather than poor], and several factors continue to constrain the market. Foreclosures are still competing with new home sales, and many builders are seeing appraisals come in at less than the cost of construction. Additionally, prospective home buyers are finding it difficult to qualify for a mortgage.”
The Improving Markets Index (IMI) isolates pockets of improving housing market conditions across the nation. In January, the IMI reported 98 markets that showed improvement for at least six months in three economic areas—housing permits, employment and housing prices. This is up from 41 in November and 76 in December. The markets, now too many to list, can be found here.
Home Sales
Table 3 shows sales of new and existing homes in January as well as the pending home sales index.
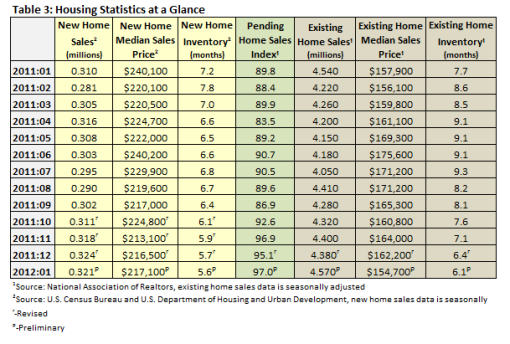
Sales of new homes fell less than 1 percent to an annualized rate of 321,000. It should be noted, however, that December’s number was revised from 307,000 to 324,000, November’s number was revised from 314,000 to 318,000, and October’s number was revised from 307,000 to 311,000.
As a result of these revisions, the Census Bureau also revised its 2011 totals. An estimated 304,000 homes were sold in 2011, down from 323,000 in 2010 (a 5.9 percent decrease).
The seasonally adjusted estimate of the number of new houses for sale at the end of January was 151,000, a supply of 5.6 months at the current sales rate.
Sales of existing homes were at a seasonally adjusted annual rate of 4,570,000 in January, according to estimates released by the National Association of Realtors (NAR). This is 4.3 percent above the downwardly revised December rate of 4,380,000 and 0.7 percent above the January 2011 estimate of 4,540,000. The NAR pegs total existing home sales in 2011 at 4,260,000, a 1.7 percent increase over 2010.
Months of inventory fell 4.7 percent to 6.1 months at the current sales rate; this is a 20.8 percent improvement over January 2011’s number of 7.7. At the end of the period, there were 2,310,000 existing homes on the market.
The Pending Home Sales Index, a forward-looking indicator based on contract signings, improved 2 percent in January to 97.0. This is 5.6 percent above January 2011, when it stood at 89.8.
Existing homes remain far more affordable than new ones. The median sales price of new houses sold in January was $217,100, and the median sales price of existing homes was $154,700 (Table 3).
In addition, the S&P/Case-Shiller Index (20-city composite), viewed by most as the best indicator of housing prices, fell 1.1 percent in December. For 2011, the total drop in home prices was 4 percent. About the new data, both Case and Shiller weighed in on what it means for the market going forward.
Yale economist Robert Shiller was in the one step up, one step back camp: “We might be on the verge of a recovery, but we might not. The concern I have is that we have positive indicators but we have downward momentum.”
Karl Case, on the other hand, pointed to household formations as a positive indicator. Between March of 2010 and March of 2011, the number of household formations actually fell, according to Case. From March to December 2011, however, the number of housing formations increased. (The average yearly number of new household formations generally falls between 1 and 1.5 million.) Case concludes: “All I’m saying is there are some bright spots. You will see demand beginning to come back and production staying at low levels.” (Read Steve Goldstein’s article for more.)
Production staying low may be the key. In addition to the homes currently on the market (151,000 new homes + 2,310,000 existing homes = 2,461,000 total), CoreLogic estimates the shadow inventory totaled 1.6 million units at the end of October 2011 (770,000 units that are seriously delinquent, 430,000 in some stage of foreclosure and 370,000 owned by lenders but not on the market). The total inventory, by this calculation, is in excess of 4 million units.
If we estimate new household formations conservatively at 1 million per year, a full recovery in the housing market could be as much as 4 years away.
Comments
06-06-2012
Prices are going down, and sales are close to neutral — hopefully we are at or at least near the bottom. Most homeowners just don’t want to sell for less than their home was “worth” a few years back, which of course was quite inflated.


