
4 min read

The biological sustainability of a forest can be measured in one of two ways, either through the volume of forest inventory or the ratio of growth-to-removals (GRR). The volume of forest inventory provides a view of the forest at a specified point in time and reflects the volume of wood fiber that accumulates as a result of tree growth. GRR is the ratio of the volume of inventory growth to the volume of inventory removals (due to harvests).
The Forest Inventory Analysis, overseen by the US Forest Service, is the standard measure of forest inventory across the country. Every five years, timber tracts throughout all forested regions in the United States are randomly selected and inventoried. Forest Service employees survey each plot to determine the amount of forest growth and removals and record any other changes that may have occurred. Forest service personnel identify each tree by species and measure both diameter and height. Using this very exact data, FIA can assess the condition of timberland resources at a local level.
Different from the static view provided by forest inventory, the GRR measures the balance between supply and demand. Growth-to-removals – the biological increase in inventory compared to harvests – demonstrates the trajectory of forest inventory.
A GRR value of 1.0 suggests that biological growth and removals are in balance. Growth-to-removals for most natural wood basins in the US South are 1.0 or above. Greater than 1.0 suggests the forest is sustainable, and perhaps underutilized, as the growth of forest inventory outpaces removals.
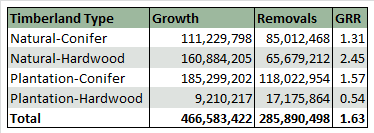
Less than 1.0 indicates removals outpace forest growth. Over the long run, a GRR that remains below 1.0 can negatively affect forest sustainability, limit harvest opportunities and place upward pressure on wood fiber prices.
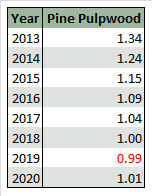
Like any piece of data, it is important to consider GRR within the proper context. A cursory glance at one segment of data – such as the year 2019 in the table below, in which Forest2Market developed a forecast of GRR for a particular wood basin – could lead one to believe a forest is in decline.
While it is true a GRR below 1.0 indicates harvests outpace forest growth, this dip below 1.0 is simply a function of a normal, expected age-class gap created when trees are not replanted as anticipated. The Great Recession that created a housing downturn is a prime example of this concept.
As many landowners delayed pine sawtimber harvests when demand for lumber declined, replantings were also delayed. This created an age class gap for the years when pulpwood—had it been replanted on schedule—would have been thinned to make room for sawtimber to grow.
When sawtimber harvests pick back up, so do replantings, and the cycle reverses itself in a short span of time. Gaps like these are natural reactions to the market, not harbingers of deforestation a lack of sustainable supply.
Changes in demand brought about by factors such as competitors entering or exiting the market or the introduction of new products like biofuels will impact the GRR of any one wood basin. When forecasting GRR, scenarios for both supply (forest growth) and demand (current removals +/- changes in demand) must be modeled and applied by industry experts in order to gain an accurate picture of sustainability.
The point at which competition for wood causes harvest removals to exceed forest growth is a tipping point. To determine which demand scenarios are feasible from both a forest health and wood raw material cost perspective, Forest2Market conducts tipping point analyses.
A number of steps go into finding a wood basin’s tipping point. Analysts must determine current forest inventory and project future inventory. They must also develop a market price threshold — typically, the maximum weighted per ton average a company can pay for material. Finally, our analysts create marginal cost curves based on the transactional data available in Forest2Market’s delivered price database.
A final analysis of these factors provides the maximum number of tons of demand a wood basin can absorb without negative ramifications. This represents the tipping point for facility-specific factors such as maximum feedstock costs as well as larger variables like the overall sustainability of the wood basin.
Tipping point analysis takes an in-depth look at complex wood supply chain dynamics and the competitive nature of forest products markets that new market entrants need to properly site and size a facility. It also identifies the point at which the depletion of forests would become a reality and other wood-consuming customers would be adversely affected.

Comments
09-19-2014
Am I not correct in my understanding that FIA inventory data represent significant estimation errors at wood basket level due to the limit plots sampling strategy adopted in gathering the data?
If so, GRR at a wood basket level say 60 mile radius or ~ 2-3 Million acres of typical S US managed woodland, would need to be much higher to be comfortable.
Comments
09-19-2014
Prima facie evidence of an unsustainable forest. The indicated growth/drain ratios document an un-sustainability managed forest resource. The rate of volume accumulation (1.31 to 2.45) cannot be sustained.
Either harvest will increase to balance (unlikely) or the forest will become unhealthy (very likely, see West Coast) and re-balance with fire, wind or insect mortality (most likely, pine beetles or ‘oak wilt” in the Ozarks anyone).
Here is a prediction, within a decade or so urgent calls for millions of dollars of tax money to “rehabilitate” unhealthy forest of the Southeastern US will become common.
Unseen in the data is that almost all of the accumulation in on public lands that in many cases are already unhealthy due to over dense forest accumulation. A small amount of total net accumulation (large accumulation per parcel, but rather small in total) is also occurring on very small private lands such as the thousands of 5 and 10 acre or slightly larger parcels.
Comments
09-22-2014
Timber and Fiber Market Analyst Javon Carter offered the following in response to comments:
FIA has large inventories of data that provide reliable estimates for large areas. Once the data is subdivided into smaller areas, such as a county, the sampling errors increase and the reliability of the estimates goes down. Looking at an 80 road-mile and 60 road-mile area in FL/GA, the sampling error increases as you move down from the 80 to the 60 road-mile area. For removals, the 80 road-mile area for softwoods has an 8.3% error (private and public landowners) with approximately 270 plots measured. The 60-road mile area for softwoods has a 10.9% error with approximately 158 plots measured.
Additionally, the private sector will have more plots to measure than the public sector in the US South. Similarly, there are more softwood plots than hardwood plots across most of the US South. Therefore, the sampling error of the public sector and hardwood species will generally be higher than the private sector and softwood species in the US South.
The Forest Survey Handbook mandates that the sampling error for an area cannot exceed 5 percent (Eastern US) or 10 percent (Western US) error per 1 billion cubic feet of growing-stock on timberland for volume, removals, and net annual growth at the 67 percent confidence level (1-standard error). In essence, growth and removal errors may be a few percentages higher than the mandated value, but we typically analyze wood basins in the US South that are large enough to be closer to the 5% mark than say a 25% error.


