
This blog post is the fifth in a series that highlights and demonstrates some of the most valuable features of the new SilvaStat360 business intelligence platform. This particular post will focus on the new Eastern North American Total Fiber sections and related tools.
SilvaStat360 is designed to be a flexible, customizable digital environment that provides you with the on-demand data that is most important to your business, and it will also be the platform by which Forest2Market delivers all of its products going forward.
Highlights of the SilvaStat360 Home Page
- The home page acts a dashboard that provides a trend graph, differential graph and data table comparing company, mill facility or sales against the market average over time.
- The first chart shows distribution of delivered price for a specific product. Total delivered price is displayed on the x axis and percent volume on the y axis. You can see the amount of volume the market is purchasing at various price points compared to the amount of volume your company is purchasing at those same price points.
- The charts on the right side of the screen show a time series trend comparing the selected mills and their delivered price against the market delivered price, which allows you to see whether your company price is above, at or below market.

Highlights of the Mill2Mill Tabs
- Your company, mill facility or sales data are highlighted in yellow and identified by mill name, making it easy to compare your performance to the performance of your peers that consume the same raw materials and operate in the same markets and areas.
- Delivered price and all component prices are displayed, including stumpage, cut-skid-load, freight, margin and “other” for all mills in a selected area consuming similar volumes of wood raw materials. The second chart shows the distribution, but instead of $/ton, it shows average size or PLF (pounds per linear foot) as well as the price per linear foot as well.
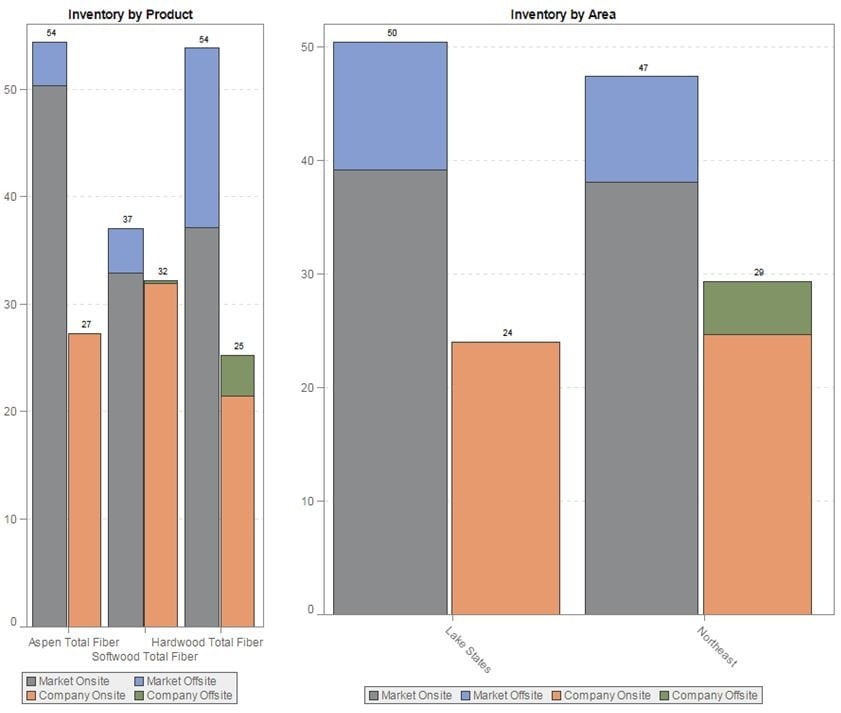
Highlights of the Inventory Tabs
- The Inventory tab shows total days of inventory for each area and for different time frames. The first chart shows a regional average for days of inventory, and the second chart shows the area averages. Selected mill averages are displayed in a contrasting color beside the area average.
- The Inventory Delivered Price Trend charts shows price/inventory data over an extended period of time. The chart shows total days of inventory and average delivered price for both the market and individual company or mill.

Other Valuable Data Available at Your Fingertips
- Economic Analysis Data: Along with price data, we also collect third party economic data—GDP, CPI, PPI, housing starts and oil prices to name a few. As a result, we can chart those indicators alongside your price in order to identify correlations.
- FIA Data: The FIA data tab provides access to the US Forest Service’s Forest Inventory and Analysis data. Forest2Market has downloaded the most recent data for each state and then transformed the data into actionable intelligence. This data allows you to filter by both geography and product and the tables show growth to removals ratio, total growth, total removals, and the inventory for all products as well.
- Precipitation: The precipitation tab shows the monthly average rainfall by county (sourced from the National Oceanic and Atmospheric Administration). Two separate charts allow you to compare two areas or the same area over two time frames.
To further familiarize yourself with some of the powerful features available within the Eastern North American Total Fiber sections of SilvaStat360, check out the demonstration videos below.


