
This blog post is the fourth in a series that highlights and demonstrates some of the most valuable features of the new SilvaStat360 business intelligence platform. This particular post will focus on the new Western Delivered Logs, Chips and Tonwood sections and related tools.
SilvaStat360 is designed to be a flexible, customizable digital environment that provides you with the on-demand data that is most important to your business, and it will also be the platform by which Forest2Market delivers all of its products going forward.
Highlights of the SilvaStat360 Home Page
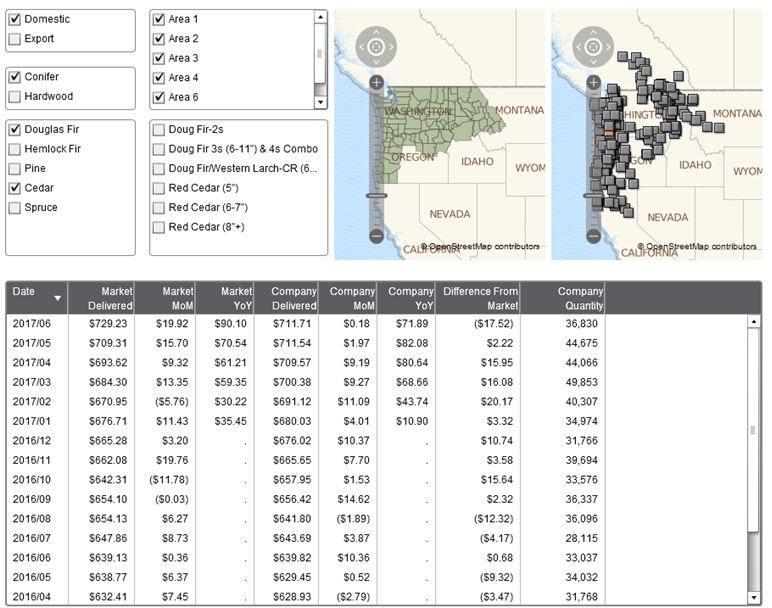
- In Western North America, you can choose one of three reports: Delivered Logs, Delivered Chips and Delivered Tonwood, by clicking on the appropriate tile. For the Western Log report, you can also sort by Domestic or Export data, or both, as well as species and products.
- The first chart shows distribution of delivered price for a specific product. Total delivered price is displayed on the x axis and percent volume on the y axis, and you can see the volume the market is purchasing at various price points compared to the volume your company is purchasing at those same price points.
- The second chart shows the distribution and price in average size or PLF (pounds per linear foot.) The Length and Diameter tab provides the ability to look at length and top diameter of products and compare them to the market.

Highlights of the Tabs
- The Western Total Fiber Mill2Mill Products tab gives you the same Mill2Mill comparison by product. This comparison also allows you to see the breakdown between chip cost and freight cost by mill.
- The Total Fiber tab also shows the total delivered price for all fiber purchases; your mill(s) will be highlighted just as they were in the old benchmarks.
- The Area Averages tab provides a market delivered price by product and by area. Use the filters to choose a time frame, product(s) and area(s), and you can also download the data.


Other Valuable Data Available at Your Fingertips
- Economic Analysis Data: Along with price data, we also collect third party economic data—GDP, CPI, PPI, housing starts and oil prices to name a few. As a result, we can chart those indicators alongside your price in order to identify correlations.
- FIA Data: The FIA data tab provides access to the US Forest Service’s Forest Inventory and Analysis data. Forest2Market has downloaded the most recent data for each state and then transformed the data into actionable intelligence. This data allows you to filter by both geography and product and the tables show growth to removals ratio, total growth, total removals, and the inventory for all products as well.
- Precipitation: The precipitation tab shows the monthly average rainfall by county (sourced from the National Oceanic and Atmospheric Administration). Two separate charts allow you to compare two areas or the same area over two time frames.
To further familiarize yourself with some of the powerful features available within the Western North America sections of SilvaStat360, check out the demonstration videos below.


