 Daniel Stuber
In our mid-year assessment of conifer exports, we demonstrated that while southern yellow pine (SYP) log exports are on a recent slide, they are gaining market share over Western Hemlock exports from the Pacific Northwest (PNW). Since the trade tensions with China continue to be a fluid situation, we wanted to present a profile of SYP historical exports and recent developments using the US Census Bureau’s trade data.
Trend – 2001 to 2012
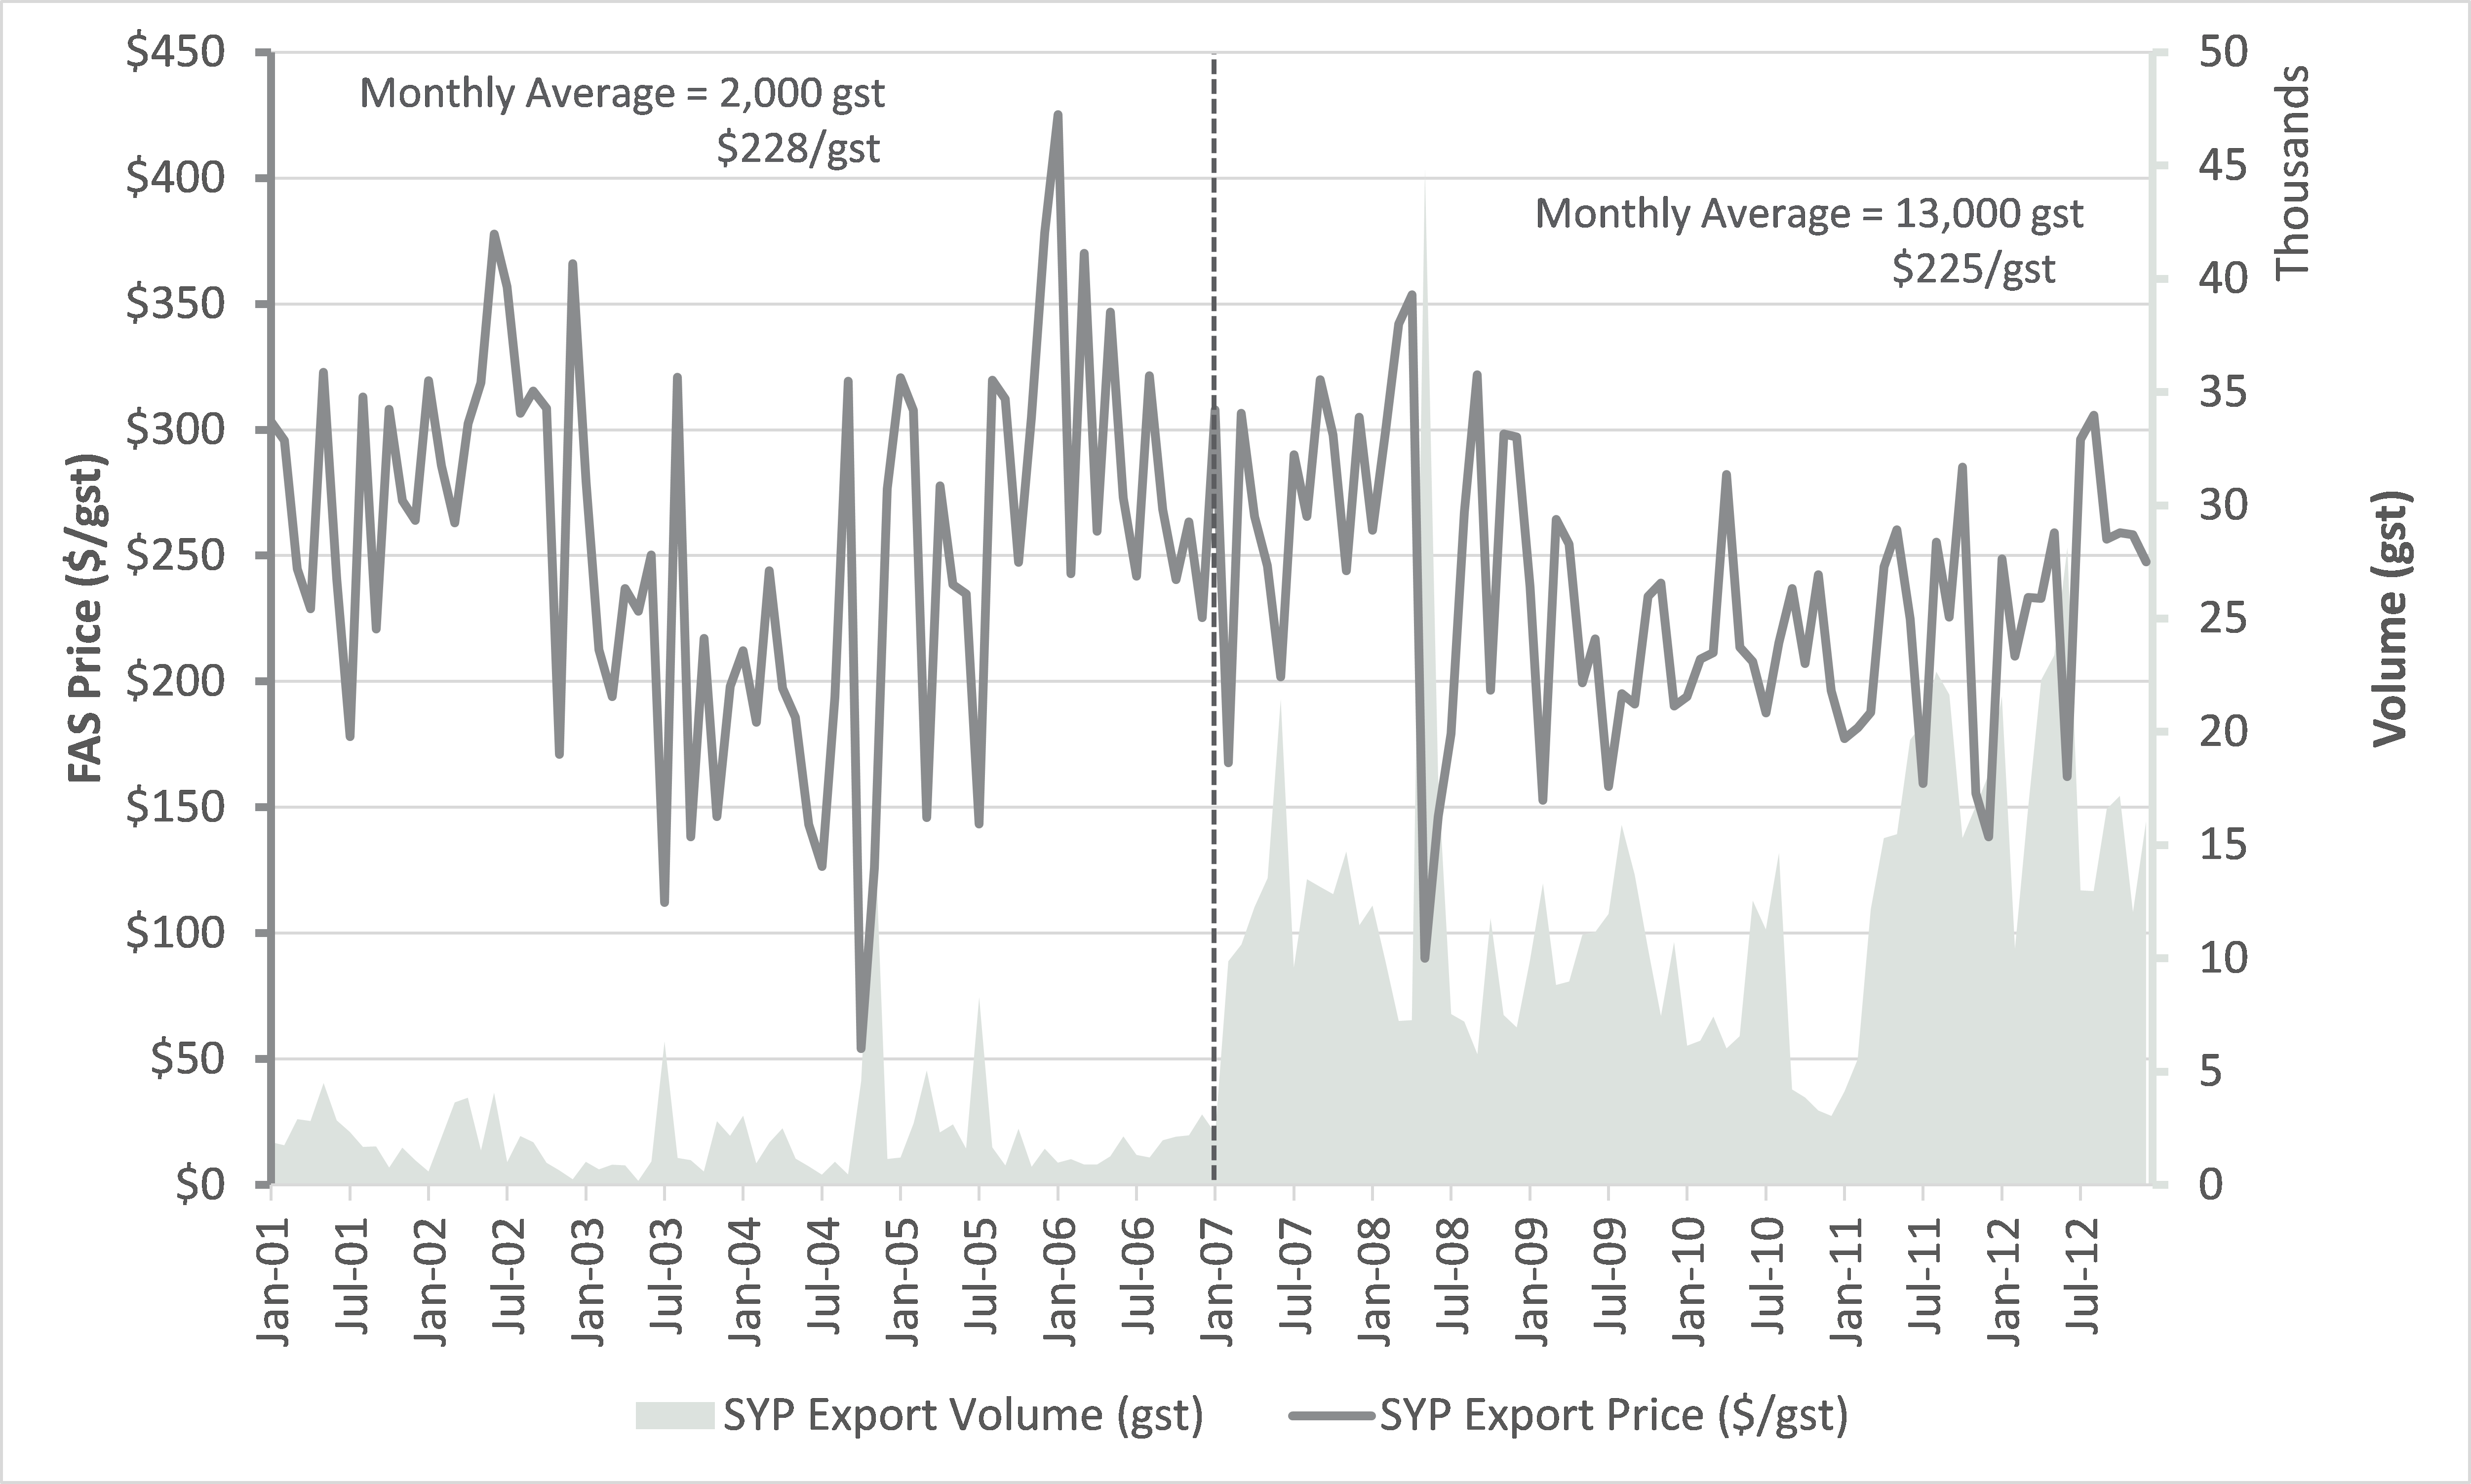
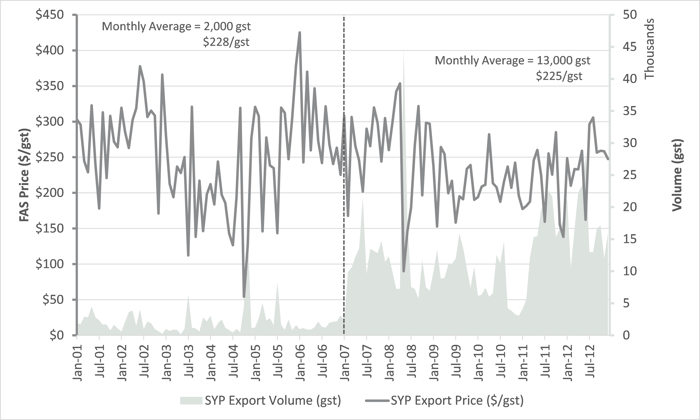
Prior to 2007, SYP log exports were almost non-existent, averaging only about 2,000 green short tons (gst) per month. Most exporters were primarily focused on hardwood species and typically only exported SYP to meet occasional, unique needs. The price of logs, free-along-side (FAS), between 2001 and 2006 averaged roughly $228/gst, and the total dollar value of exports was roughly $5.8 million per year.
In 2007, however, exports of SYP began to expand as the US housing bubble popped, lumber production and domestic log demand began to decline and the economy entered the Great Recession. Primarily driven by depreciation of the dollar against world currencies, SYP logs became more affordable and export volume increased to 13,000 gst per month. The price of logs averaged $225/gst, and the total dollar value of exports was $34.0 million per year.
While 13,000 gst doesn’t sound like an extraordinary volume, an interesting dynamic developed during the latter half of this period (2007-2012). Prior to 2010, the majority of SYP exports were destined for various regions such as Egypt, Taiwan, Spain and the Caribbean. But in 2010, China became the second largest export destination, purchasing roughly 17,000 gst. Then, in the following year, China purchased 109,000 gst, which represented the largest volume of SYP exports to any one country during the 2000s. While China’s number declined to 42,000 gst in 2012, it still maintained a significant level of exports and was the second largest export destination behind India. However, 2013 would be a pivotal year for SYP exports, and China became the dominant export destination for the years that followed.
Trend – 2013 to 2017
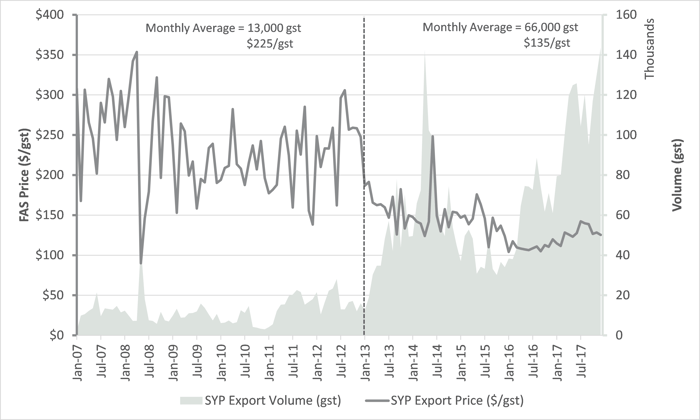
Beginning in January 2013, export prices for SYP dropped significantly and volume ratcheted upward. Export prices continued to decline over the next three years and while export volume was volatile over the 2013 to mid-2016 period, the overall level increased from a monthly average of 13,000 gst (2007-2012) to 56,000 gst. Then, beginning in July 2016 (after the Panama Canal’s expansion project was finally completed), log price began to slowly inch higher but export volume exploded to average of 98,000 gst between July 2016 and 2017. Over the entire five-year period, export volume averaged 66,000 gst, export prices averaged $135/gst and the total dollar value of exports was $107.2 million per year.
Trend – 2018 to Today
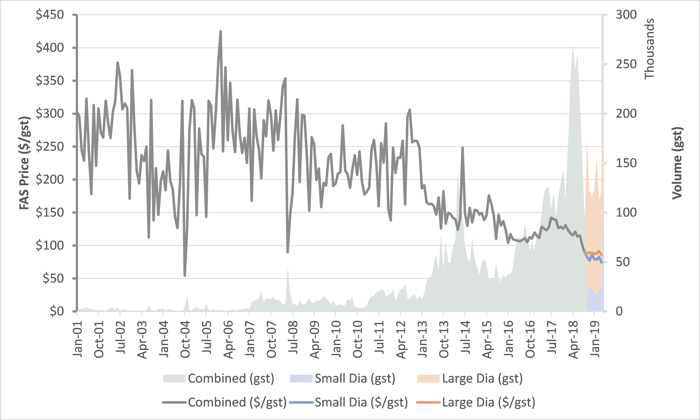
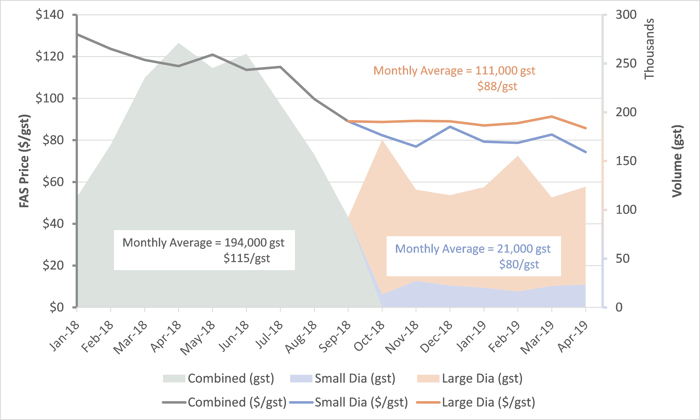
Entering 2018, export volume continued to climb, surpassing 200,000 gst in March 2018 and peaking at 271,000 gst in April 2018. But beginning in August 2018, export volume declined rapidly as China could no longer prop up its economy and the ghost towns it had built, and as the trade war with the US escalated. Starting in August 2018, export volume has been variable, but averaging roughly 127,000 gst. Most recent data available for April 2019 reflected 124,000 gst of export volume. While this is far below the early 2018 time period, exports still remain much higher than prior years and the trend appears to be stabilizing as exporters have absorbed the 25% tariff rate and prices have declined from their pre-2018 rate of $115/gst to April 2019 rate of $84/gst.
One area of particular interest in our analysis is the recent change in the Harmonized System (HS) codes for SYP logs. Historically, all diameters of SYP exports were combined. However, starting in October 2018, exports were separated into two diameter classes: Any cross-sectional portion of the log less than 15 centimeters (5.9 inches), and logs greater than or equal to 15 centimeters. While only 15–20 percent of the export volume is traded in the small diameter class, the price difference between these classifications has averaged roughly $8.00/gst. Interestingly, this corresponds closely with the $7.00/gst gap between Forest2Market’s stumpage prices for sawtimber and chip-n-saw in our coastal micromarkets over the same time period.
It appears the SYP export market is becoming more efficient and market advantageous as it develops. We predict that when the trade war begins to subside and China’s economy stabilizes, SYP exports will increase. What will be of interest is whether the gap will change between these two HS classes, and by how much.
(Entire Time Period Analyzed)