The Food & Agriculture Organization of the United Nations (FAO) recently released its Global Forest Resources Assessments (FRA) for 2015, which is a comprehensive report produced every five years that provides a consistent overview of the world's forests and how they are changing. FAO has been monitoring the world's forests at five- to ten-year intervals since 1946, and the current Assessment is derived from two primary sources of data: Country Reports prepared by National Correspondents and remote sensing that is conducted by FAO together with national focal points and regional partners.
Countries representing roughly 75 percent of the world’s forest area contributed to the FRA 2015 content. Data are reported for 234 countries and territories, of which 155 reports come from individual countries themselves—countries that contain 98.8 percent of the world’s forests. The remaining 79 countries and territories (covering 1.2 percent of the world's forests) were reported as desk studies prepared by FAO. FRA 2015 contains 120 variables covering a 25-year period from 1990-2015.
While the report focuses on many of the broad-scale changes within the world’s forests over the last 25 years, the news is generally positive and serves to highlight the importance of utilizing improved, accurate data when compiling such an Assessment. “FRA 2015 shows a very encouraging tendency towards a reduction in the rates of deforestation and carbon emissions from forests and increases in capacity for sustainable forest management. The reliability of the information collected has also improved enormously – presently national forest inventories apply to some 81 percent of global forest area, a substantial increase over the past 10 years.”
The report continues “Two broad conclusions can be drawn: 1) we have a wealth of reliable information today on the situation of the world’s forests; and 2) the direction of change is positive, with many impressive examples of progress in all regions of the world. However this positive trend needs to be strengthened, especially in the countries that are lagging behind.”
The Assessment is packed with helpful information for monitoring activity in various global regions and economies, and it succinctly pulls together much of the information to provide valuable statistics about forest trends. Highlights from FRA 2015 include:
General Forest Volumes and Trends
-
There was a net loss of some 129 million ha (319 million acres) of forest (natural and planted) from 1990 to 2015, representing an annual rate of –0.13 percent and a total area about the size of South Africa. Still, this should be understood in context: the net annual rate of loss has slowed from –0.18 percent in the 1990s to –0.08 over the last five year period. Between 2010 and 2015 there was an annual loss of 7.6 million ha (18.8 million acres) and an annual gain of 4.3 million ha (10.6 million acres) per year, resulting in a net annual decrease in forest area of 3.3 million ha (8.1 million acres) per year.
-
The biggest forest area loss occurred in the tropics, particularly in South America and Africa, although the rate of loss in those areas has decreased substantially in the past five years. Average per capita forest area declined from 0.8 ha (1.9 acres) to 0.6 ha (1.5 acres) per person from 1990 to 2015.
-
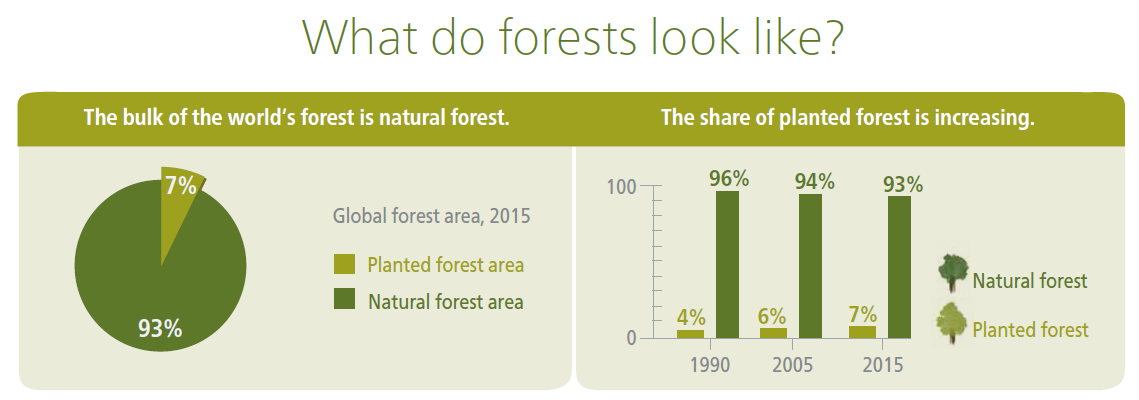
The bulk of the world’s forest is natural forest, amounting to 93 percent of global forest area or 3.7 billion ha (9.1 billion acres) in 2015. From 2010 to 2015, there has been a reduction in net annual natural forest loss from 8.5 million ha (21 million acres) per year (1990 to 2000) to 6.6 million ha (16.3 million acres) per year (2010 to 2015).
-
Planted forest area has increased by over 110 million ha (272 million acres) since 1990 and accounts for 7 percent of the world’s forest area. The average annual rate of increase between 1990 and 2000 was 3.6 million ha (8.9 million acres).

Forest Economics, Ownership & Management
-
The forest sector contributes about $600 billion annually to global GDP, or about 0.8 percent of global GDP. Of this, forestry and logging in 2011 contributed some $150 billion, which accounted for about 0.2 percent of the global economy.
-
The forest sector currently employs about 1.7 percent of the global workforce, of which 0.4 percent work in the forest. The remainder works in transport, processing and manufacturing activities outside the forest.
-
The production/consumption of wood in general has increased throughout the 25-year period while reliance on wood fuel has remained steady. In 1990, annual wood removals amounted to 2.8 billion cubic meters, of which 41 percent was for wood fuel; in 2011 annual wood removals amounted to 3.0 billion cubic meters, of which 49 percent was for wood fuel. Both the proportion of wood removals used for fuel and the total amount of wood used for fuel have increased.
-
In 2010, 74 percent of the global forest area was publicly owned, 19 percent was private, 4 percent was of unknown ownership and 3 percent was unreported. The proportion of privately-owned forests has increased from 13 percent in 1990 to 19 percent of the total forest area in 2010.
-
Most of this increase in private ownership has been in upper middle-income countries. However, for countries with private forests, it is a much larger proportion: in 1990 nearly 26 percent of the forest in these countries was owned privately, a number that increased to 30 percent in 2010.
-
The area of forest under management plans has increased substantially. In 1953, forest management plans covered around 27 percent of production forest area and in 2010, plans covered roughly 70 percent of production forest area.
-
The area covered by forest management certification has grown dramatically from 18 million ha (44.5 million acres) in 2000 to over 430 million ha (1.06 billion acres) in 2014. Roughly 90 percent of the total area certified in 2014 is in the temperate and boreal climatic domains.
The full Assessment, along with other helpful maps, studies, etc. published by the FAO, is available via the organization’s website. A high-level, educational infographic highlighting some of the 2015 data is also available.