
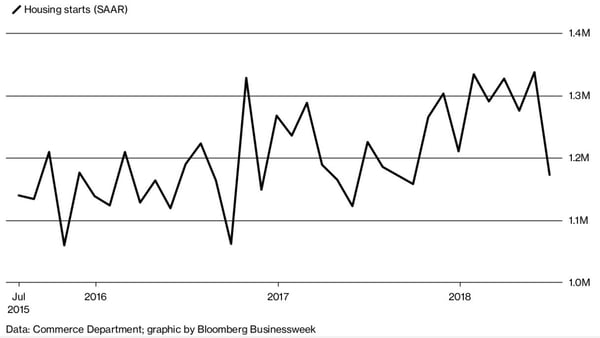
On the heels of reaching an 11-year high just a month ago, US housing starts fell to a nine-month low in June and permits declined for a third straight month. The percent drop was the largest since November 2016, suggesting that new housing activity may have hit a temporary peak.
Housing Starts, Permits & Completions
After jumping 11 percent in May, housing starts dropped 12 percent in June to a seasonally adjusted annual rate (SAAR) of 1,173,000 units. Single-family starts accounted for 858,000 units, which is 9.1 percent below the revised May figure of 944,000. Starts for the volatile multi-family housing segment plunged 19.8 percent to a rate of 315,000 units in June; starts for buildings with five or more units fell to a 10-month low.
Privately-owned housing authorizations dropped 2.2 percent to a rate of 1,301,000 units in June. Single-family authorizations fell to 850,000, which is 0.8 percent above the revised May figure.
Privately-owned housing completions were flat at a SAAR of 1,261,000 in June. Regional performance was down across the board as confirmed by the US Census Bureau report, although unlike like month when the Midwest drove nearly all of the growth, the same region accounted for a lion’s share of the decline. Seasonally-adjusted total housing starts by region included:
- Northeast: -6.8 percent (-15.0 percent last month)
- South: -9.1 percent (-0.9 percent last month)
- Midwest: -35.8 percent (+62.2 percent last month)
- West: -3.0 percent (-4.1 percent last month)
Seasonally-adjusted single-family housing starts by region included:
- Northeast: +3.1 percent (+10.2 percent last month)
- South: -6.8 percent (-3.5 percent last month)
- Midwest: -29.1 percent (+44.4 percent last month)
- West: -3.6 percent (-0.5 percent last month)
The 30-year fixed mortgage rate decreased from 4.59 to 4.57 percent in June, and the National Association of Home Builders (NAHB)/Wells Fargo builder sentiment index remained unchanged at 68 in early July.
“Builders are encouraged by growing housing demand, but they continue to be burdened by rising construction material costs,” said NAHB Chief Economist Robert Dietz. “Builders need to manage these cost increases as they strive to provide competitively priced homes, especially as more first-time home buyers enter the housing market.”
Last year, the Trump administration imposed anti-dumping and countervailing duties on imports of Canadian softwood lumber, which builders say have boosted the price of new single-family homes. Together with a lack of land and labor, rising material costs have exacerbated an already acute shortage of homes for sale, weakening the larger housing market.
“We’re seeing pressure on both sides of the market, from increasingly expensive inputs on the supply side to prices that are charging ahead of wage growth on the demand side, and the result is that neither builders nor buyers can keep up,” said John Pataky, executive vice president at TIAA Bank in Jacksonville, Florida.
Is Supply Really Constrained?
News articles about housing frequently propose that there is a shortfall in the supply of new housing relative to demand, but is that really what’s happening in the market? Delphi Advisors provide analytical insights about this topic in Forest2Market’s most recent issue of The Economic Outlook:
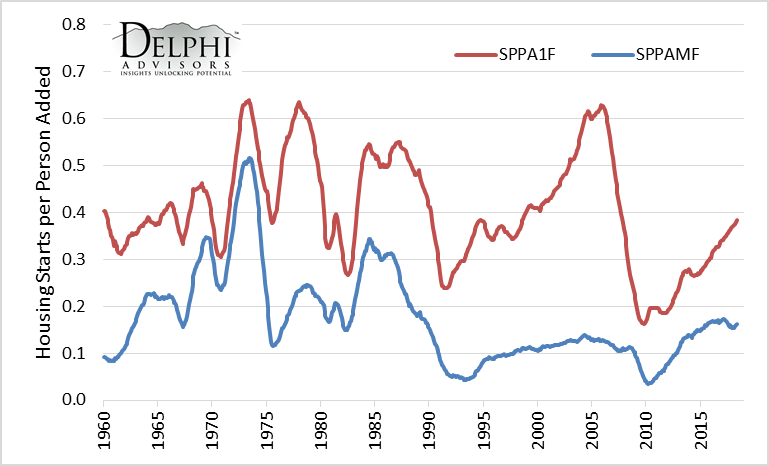
If new supply is keeping up with population growth, then where is the problem? To begin answering these questions, Delphi Advisors derived a metric—called “starts per person added” (SPPA)—in which monthly not-seasonally adjusted single- and multi-family starts are divided by the monthly change in the US population.
As one might imagine, given the cyclicality of births and construction activity within a calendar year, there is considerable MoM and YoY variability in both the single-family (SPPA1F) and multi-family (SPPAMF) metrics. Comparing recent results—and in particular, 12-month moving averages (Figure 1) to eliminate seasonality—against long-term averages reveals interesting patterns, however.
Figure 1: Housing Starts per Person Added 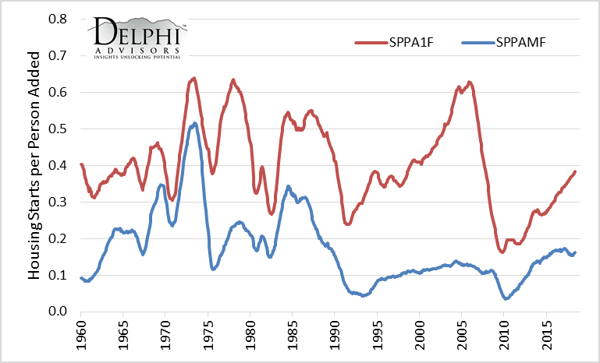
SOURCE: Delphi Advisors
For the entire period January 1959 to May 2018 the average SPPA1F = 0.405; the pre-2000 SPPA1F average = 0.420. Put another way, prior to 2000, one single-family home was started for every 2.38 people added to the population.
Between January 2000 and July 2007 (i.e., the housing bubble and early part of the subsequent crash) SPPA1F exceeded its pre-2000 average during 84 of those 91 months, peaked at 0.628 in November 2005, and averaged 0.520. Although SPPA1F has been consistently rising from its October 2009 minimum of 0.162 (2009:10 minus present average = 0.277) it has yet to regain the pre-2000 average. When adjusted for population growth, the single-family housing bust of the Great Recession and its aftermath was deeper and, to date, has been over 50% longer than the preceding bubble.
Not surprisingly, the multi-family segment exhibits a different pattern. The 1959:01-2018:05 average SPPAMF = 0.174; the pre-2000 SPPAMF = 0.198. I.e., pre-2000, one multi-family unit was started for every 5.05 people added to the population. SPPAMF during 2000:01-2007:07 averaged 0.123, reflecting the overwhelming market preference for single-family units.
SPPAMF rebounded off its October 2009 low of 0.021 (2009:10-present average = 0.127), but has been gradually subsiding on trend since February 2017’s peak of 0.174. Like its single-family counterpart, SPPAMF has yet to regain its pre-2000 average.
Putting together both halves of the above analysis, housing supply has indeed failed to keep pace with population growth. Moreover, unless multi-family starts again trend higher, the gap could continue widening. Combining our analysis with the “5 Ls”—lending, lots, labor, local regulatory concerns, and increasingly, lumber (both availability and price)—described by NAHB Chief Economist Robert Dietz, implies supply-side headwinds that could prove difficult to overcome despite compelling demographic support.


